


 Claim Ownership
Statistical Methods & Thinking
Subscribed: 1Played: 3
Subscribe

© Weijing Wang @ NYCU
Description
The materials in this podcast are generated by NotebookLM based on the lecture notes of the course Applied Statistical Methods, offered at NYCU and taught by Weijing Wang.
The podcast covers core methods for analyzing associations in data, including correlation analysis, simple and multiple linear regression (estimation, testing, and model checking), and discussions on association versus causation. It also introduces methods for categorical data analysis such as contingency tables, chi-square tests, logistic regression, and the generalized linear model framework.
The podcast covers core methods for analyzing associations in data, including correlation analysis, simple and multiple linear regression (estimation, testing, and model checking), and discussions on association versus causation. It also introduces methods for categorical data analysis such as contingency tables, chi-square tests, logistic regression, and the generalized linear model framework.
13 Episodes
Reverse

In this episode, we introduce the core ideas behind analyzing time-to-event data—situations where the outcome isn’t just “what happened,” but when it happened. A key challenge is that some participants haven’t experienced the event yet by the end of follow-up (or they drop out), so the data are only partially observed.We build the intuition for describing how risk changes over time, then walk through three practical tools: how to estimate a survival curve from one group, how to compare two groups fairly over the whole follow-up, and how to study the role of multiple predictors while keeping the time dimension front and center.
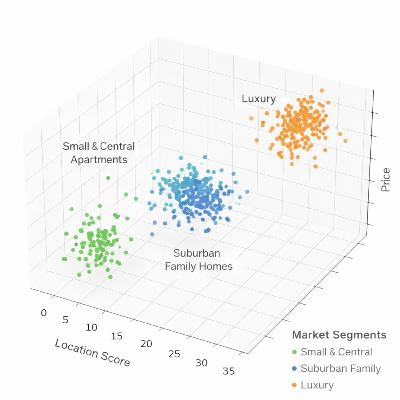
In this episode, we step into multivariate thinking and ask a practical question: when do data points naturally form “groups,” and how can we use those groups to make decisions?We walk through how grouping methods decide what’s “close” or “similar,” then compare two main approaches—building clusters step by step versus forming clusters all at once. You’ll also hear how tree-like visual summaries help us see structure in messy data, and how the same multivariate ideas can be flipped into classification, where the goal is to assign a new case to the most likely group.
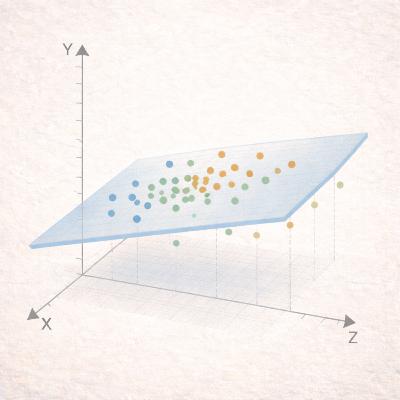
This episode is about what to do when your data has many variables at once. We start with the basic idea of how variables “move together” (correlation and covariance), and why that matters for understanding patterns in real datasets.Then we introduce dimension reduction—ways to compress lots of information into a few summary features, so you can see the main structure without getting lost in details. We explain how these methods find the directions where the data varies most, and how a simple “rotation” can make the results easier to interpret.We wrap up with practical rules of thumb for deciding how many components to keep, and a quick preview of how these ideas connect to grouping similar observations and classifying new cases.

This episode is about working with categorical outcomes—questions where results fall into categories rather than a numeric scale. We learn how to check whether two variables are related, how to model the chance of a “yes/no” outcome using multiple predictors, and how to compare different modeling choices. We finish with simple ways to judge how well a model fits and whether a simpler or more detailed model is the better choice.

In this episode, we start with Fisher’s “Lady Tasting Tea”—a classic reminder that good questions need good experimental design. Then we shift from continuous outcomes to categorical data: how a simple 2×2 table turns test results into sensitivity/specificity, and study results into association measures like relative risk and odds ratios.Next, we unpack Simpson’s paradox—how the headline conclusion can flip once you stratify by a key factor. We wrap up with practical inference tools, including Fisher’s exact test and the chi-square test, plus a quick nod to ROC/AUC for evaluating classifiers.

Comments

Download from Google Play

Download from App Store
 United States