


“How to game the METR plot” by shash42
Description
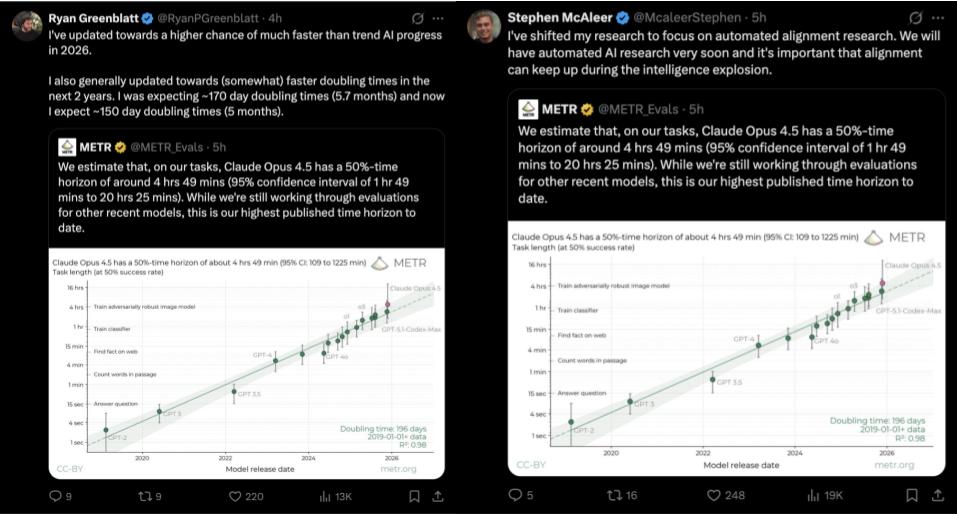
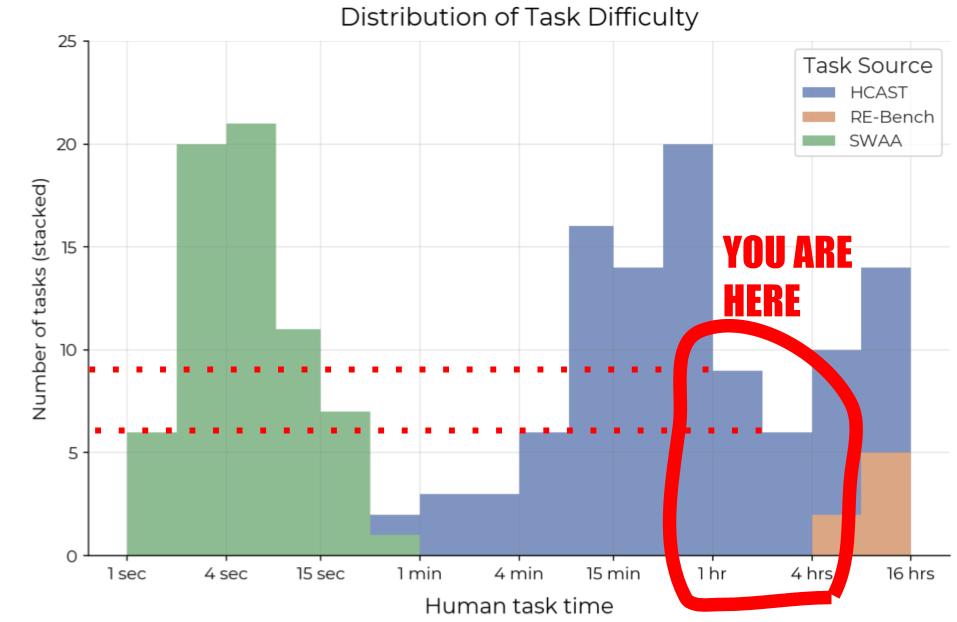
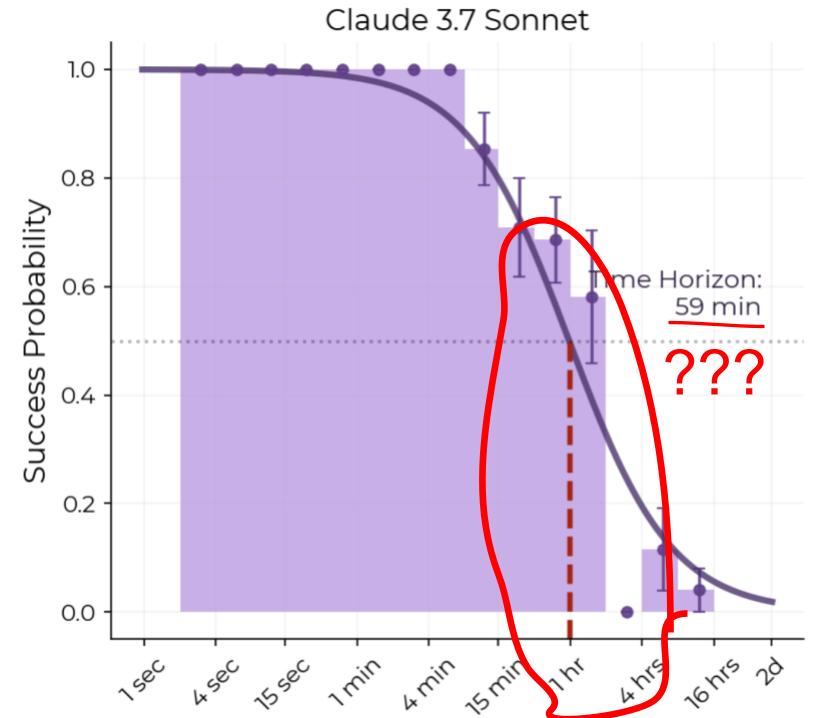
TL;DR: In 2025, we were in the 1-4 hour range, which has only 14 samples in METR's underlying data. The topic of each sample is public, making it easy to game METR horizon length measurements for a frontier lab, sometimes inadvertently. Finally, the “horizon length” under METR's assumptions might be adding little information beyond benchmark accuracy. None of this is to criticize METR—in research, its hard to be perfect on the first release. But I’m tired of what is being inferred from this plot, pls stop!
14 prompts ruled AI discourse in 2025
The METR horizon length plot was an excellent idea: it proposed measuring the length of tasks models can complete (in terms of estimated human hours needed) instead of accuracy. I'm glad it shifted the community toward caring about long-horizon tasks. They are a better measure of automation impacts, and economic outcomes (for example, labor laws are often based on number of hours of work).
However, I think we are overindexing on it, far too much. Especially the AI Safety community, which based on it, makes huge updates in timelines, and research priorities. I suspect (from many anecdotes, including roon's) the METR plot has influenced significant investment [...]
---
Outline:
(01:24 ) 14. prompts ruled AI discourse in 2025
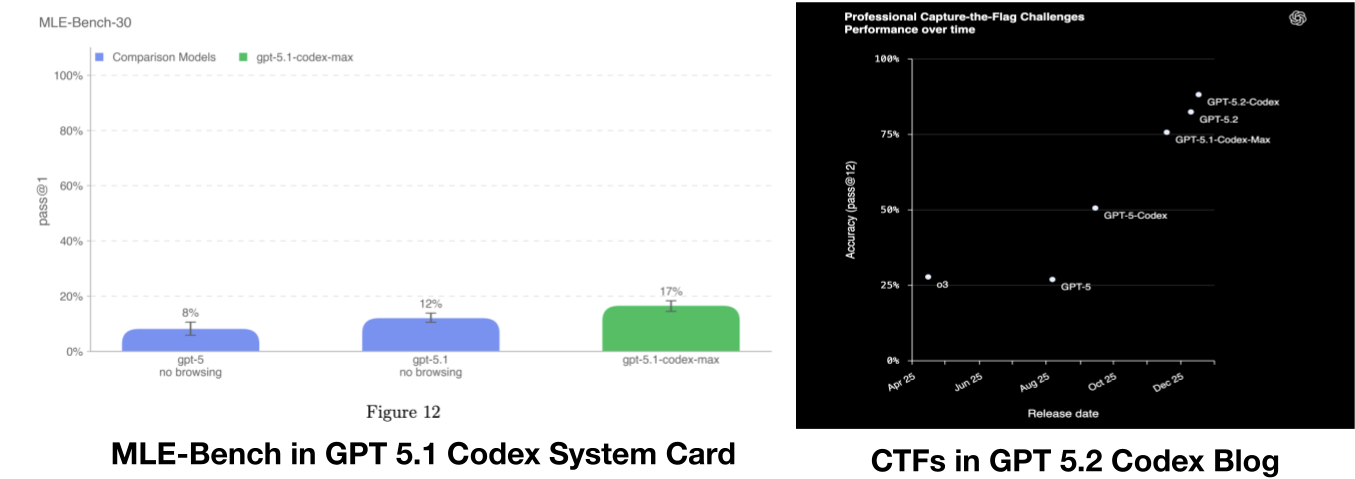
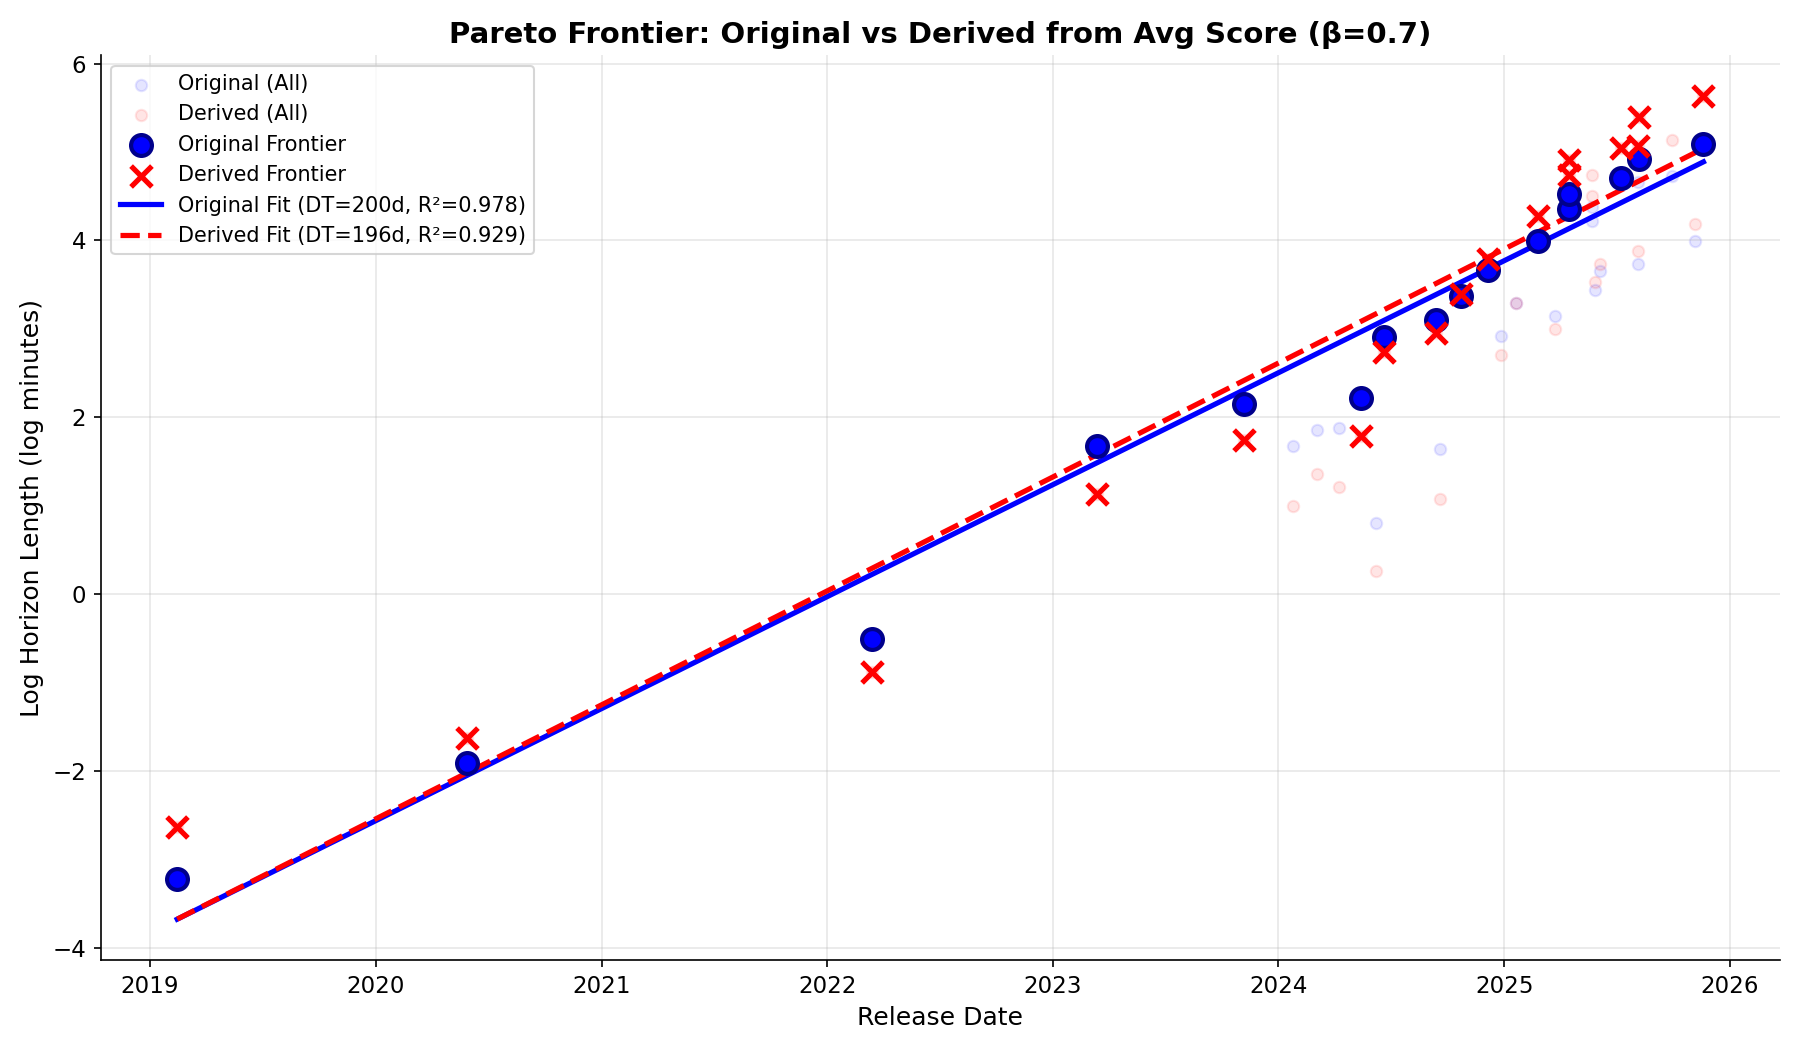
(04:58 ) To improve METR horizon length, train on cybersecurity contests
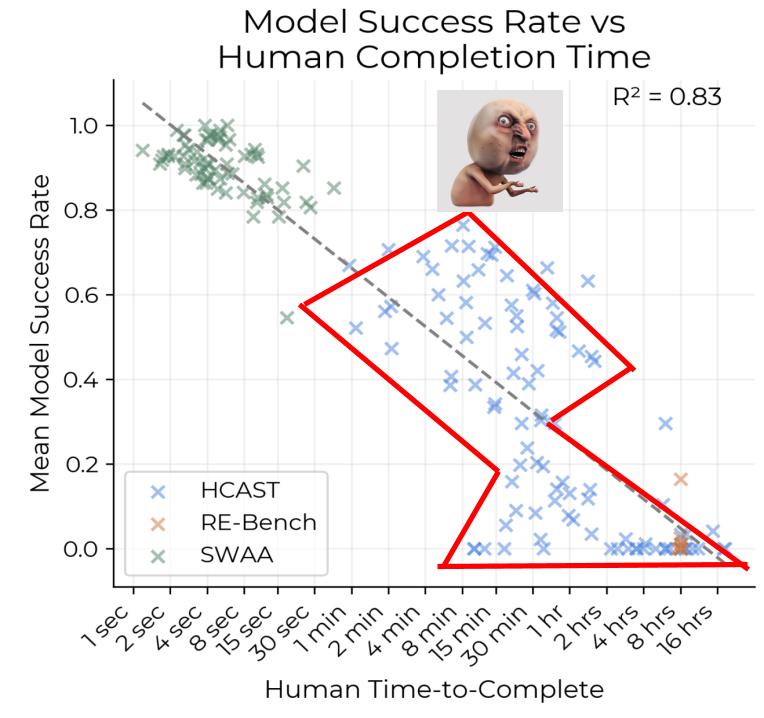
(07:12 ) HCAST Accuracy alone predicts log-linear trend in METR Horizon Lengths
---
First published:
December 20th, 2025
Source:
https://www.lesswrong.com/posts/2RwDgMXo6nh42egoC/how-to-game-the-metr-plot
---
Narrated by TYPE III AUDIO.
---
Images from the article:


Apple Podcasts and Spotify do not show images in the episode description. Try Pocket Casts, or another podcast app.


 United States
