Navigating the Statistical Seas: Five Pillars of Effective Data Analysis
Description
Throughout my early journey in data science, I often felt overwhelmed by the multitude of statistical techniques at my fingertips. It wasn’t until a mentor introduced me to five guiding principles that I began to make sense of the chaos. These fundamental concepts not only simplified the decision-making process but drastically enhanced the efficacy of my analyses and insights. Join me as I explore these five pillars, illustrating how they can shape your analytical journey too.
The 80/20 Rule: Understanding Core Concepts
The 80/20 rule, also known as the Pareto principle, is a game-changer in the realm of data science. It states that roughly 80% of effects come from 20% of causes. This fundamental idea has shaped my approach to data analysis significantly. When I began my journey in this field, I was overwhelmed by the vast array of techniques available. But as I delved deeper, I realized that focusing on just a handful of core statistical concepts could lead to the bulk of my analytical outcomes.
The Core Statistical Concepts
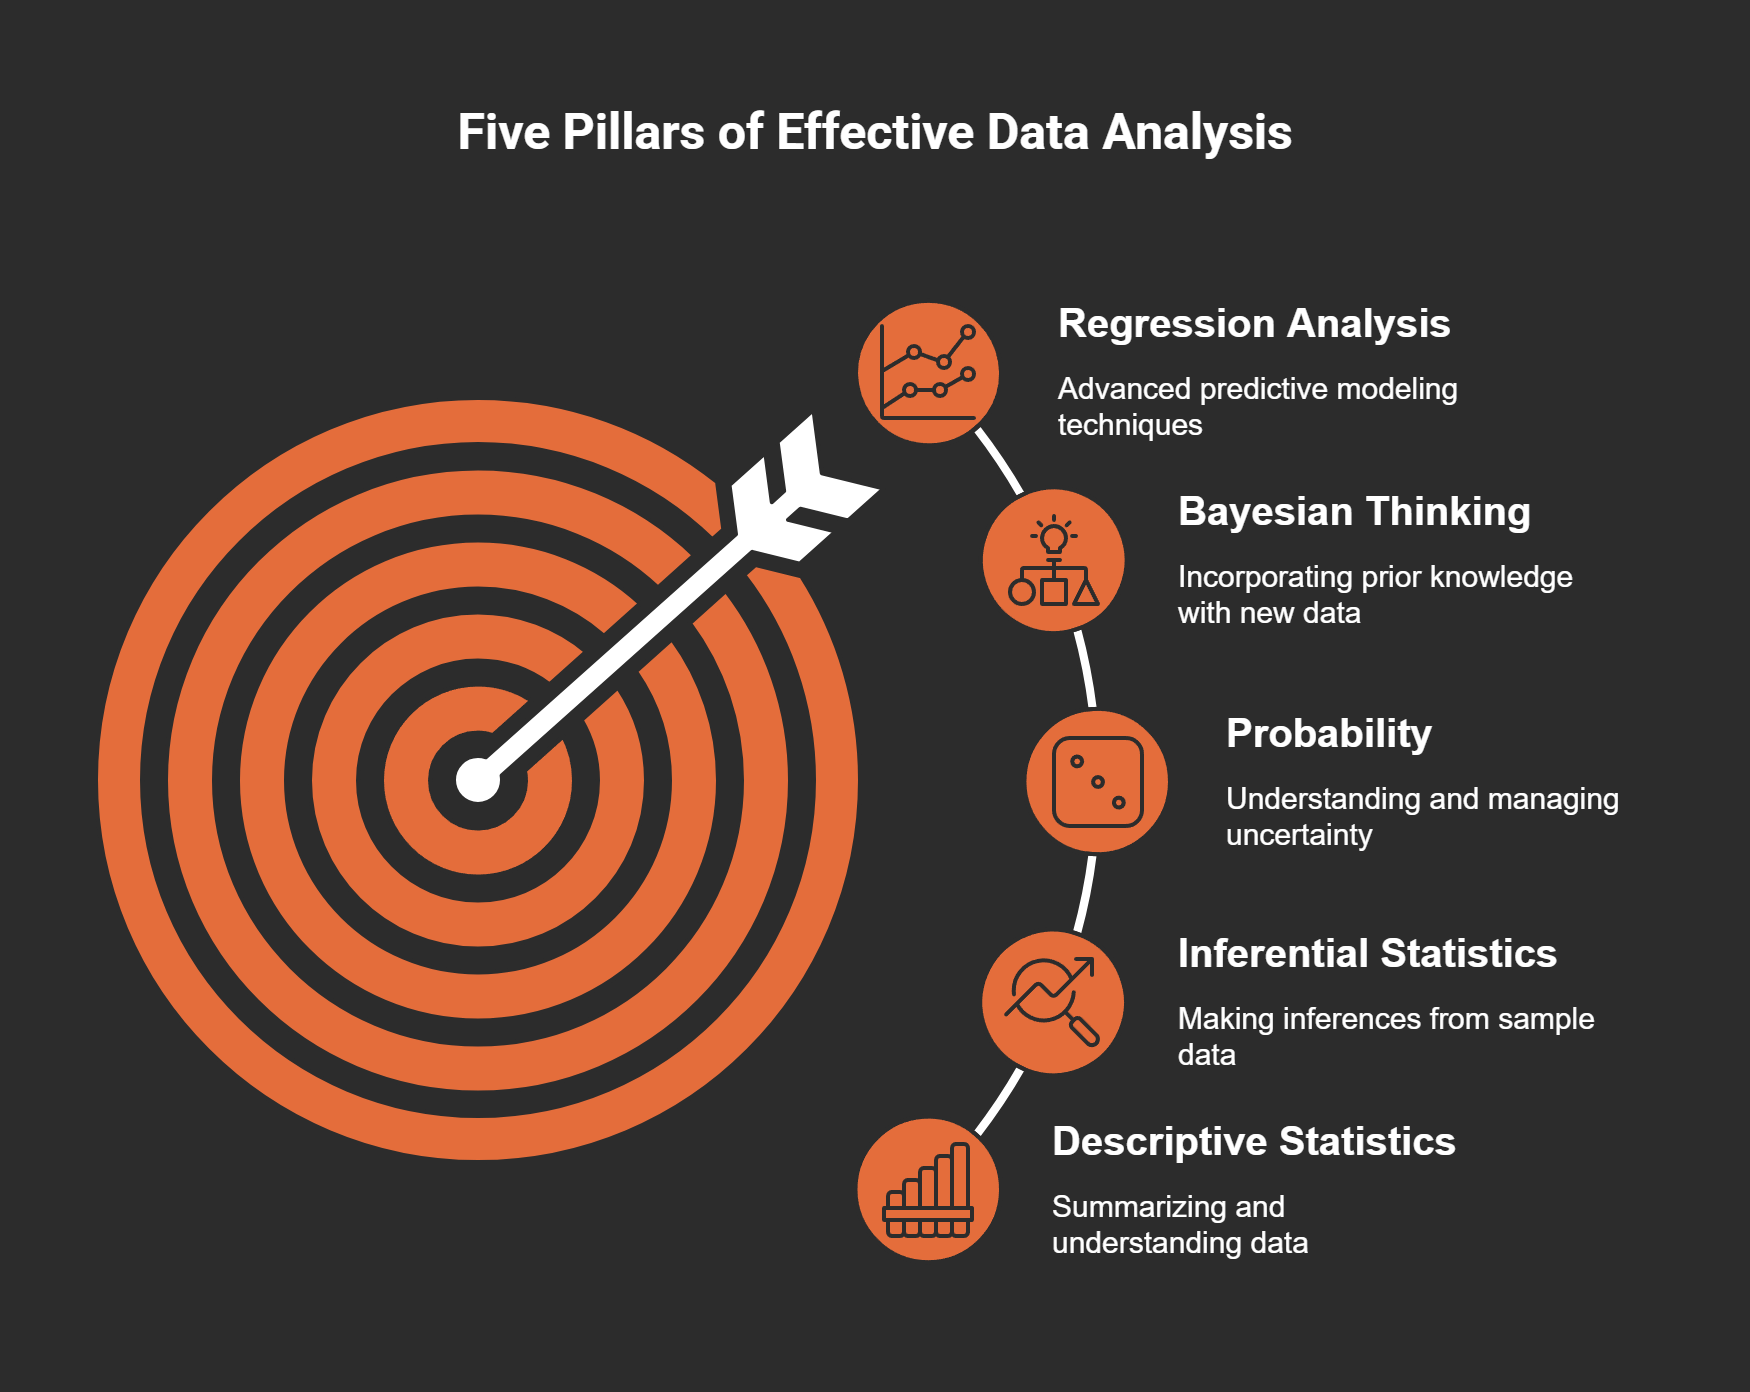
So what are these essential concepts? I identified five core statistical principles that I believe are crucial:
* Descriptive Statistics
* Inferential Statistics
* Probability
* Bayesian Thinking
* Regression Analysis
By focusing on these five areas, I found that my ability to generate valuable insights improved dramatically. This is the essence of the 80/20 rule: less can be more.
Personal Anecdote
Let me share a personal experience. In the early days of my data science training, I often struggled with advanced techniques. The complexity was daunting. My mentor introduced me to these five core principles, and it transformed my understanding. I began to see that these fundamentals could simplify decision-making and enhance my analytical effectiveness.
The Importance of Simplicity
Why does this matter? Because in data science, more isn't always better. Focusing on the essentials allows for clearer thinking and better outcomes. As
"Simplicity is the ultimate sophistication." – Leonardo da Vinci
suggests, embracing simplicity can lead to profound insights.
Maximizing Analytical Outcomes
Understanding and applying these core concepts can significantly maximize analytical outcomes. For instance, when I use descriptive statistics, I can summarize and grasp my data, leading to informed decisions. I remember analyzing transaction data from a retail chain—discovering the differences between mean and median transaction values highlighted how outliers could skew results. This insight directly influenced our marketing strategy.
Incorporating inferential statistics allows me to make predictions based on sample data. For example, while working with a software company, we tested a redesign on a sample of users. This analysis helped predict outcomes for the entire user base, reinforcing the importance of these core concepts.
Recognizing Risks and Uncertainties
Probability is another crucial aspect. It helps me navigate uncertainties and manage risks effectively. Different interpretations of probability can greatly influence decision-making processes. Understanding concepts like conditional probability allows us to optimize marketing strategies significantly.
In education and practice, I often find that embracing these statistical foundations leads to clearer insights and improved decision-making across various domains. By focusing on what truly matters, I can tackle complexity with greater confidence.
So, let’s continue this journey together. Dive deep with me in the Podcast as we explore the intricate yet fascinating world of data science.
Descriptive Statistics: The Foundation of Understanding Data
In the vast world of data science, descriptive statistics serve as a vital foundation. But what exactly are descriptive statistics? Simply put, they are methods for summarizing and understanding large datasets. They provide a clear snapshot of the data, highlighting key attributes like central tendency, variability, and distribution. This is significant because without a solid understanding of these elements, we risk making decisions based on incomplete or misleading data.
Understanding Central Tendency, Variability, and Distribution
Central tendency refers to the typical value in a data set. It’s often represented by the mean, median, or mode. The mean is the average, while the median gives you the middle value when data is sorted. Variability describes how spread out the data is. Are most values close to the mean, or is there a large range? Lastly, distribution shows us how data points are spread across different values. Recognizing these characteristics enables us to interpret data accurately.
Let me share a personal experience. While analyzing a vast retail transaction dataset with over 100,000 rows, I made a fascinating discovery. I compared the mean and median transaction values and noticed a significant difference. The mean value was skewed upward due to a few high-value transactions, leading to a distorted view of the typical transaction size. This realization was crucial. It helped me understand how outliers can impact averages and ultimately informed decisions related to pricing and inventory.
Key Takeaways from Mean vs Median Analysis
* Outlier Influence: Don't let outliers dictate your data analysis.
* Use Median: When in doubt, use the median for a more accurate representation of central tendency in skewed data.
* Consider Context: Always assess the context of your findings before making decisions.
This experience underlined a crucial point: statistical insights lead to informed decisions. For instance, after recognizing the outlier impact, I proposed targeted marketing strategies that focused on typical customer behavior rather than skewed averages. Understanding the data distribution allowed us to optimize our inventory management effectively. This is why I resonate with W. Edwards Deming's quote:
“Without data, you're just another person with an opinion.”
Informed Decisions Based on Descriptive Statistics
Descriptive statistics are not just numbers on a spreadsheet; they hold the key to strategic decision-making. By summarizing data effectively, we can make choices that significantly impact our operations. For example:
* Using mean and median insights, we adjusted our pricing strategy, resulting in improved sales.
* Identifying sales patterns through variability allowed us to forecast demand more accurately.
* Understanding customer purchasing behavior helped tailor our marketing efforts.
In conclusion, mastering descriptive statistics is essential for anyone working with data. It enables us to summarize complex datasets, identify trends, and make informed decisions that drive success. So, as we delve deeper into the world of data analysis, let’s remember that a solid grasp of these foundational principles is key. Let’s explore further together—deep dive with me in the Podcast!
Inferential Statistics: Decision-Making with Sample Data
Inferential statistics, what does it mean? At its core, it's about making inferences or predictions about a larger population based on a sample of data. Think of it like tasting a soup. You don't need to drink the entire pot to know if it needs salt. A small sample can give you a good idea of what's in the whole. In the world of data, this concept is incredibly powerful.
The Role of Hypothesis Testing and Confidence Intervals
Hypothesis testing and confidence intervals are two fundamental aspects of inferential statistics. So, what are they? Hypothesis testing allows us to take an educated guess about a population based on sample data. We set up a null hypothesis, which is a statement that there is no effect or no difference, and an alternative hypothesis, which suggests there is an effect or a difference.
Now, confidence intervals provide a range of values that likely contain the population parameter. Imagine you're trying to predict the average height of adults in a city. You measure a small group and create a confidence interval around your estimate. This interval gives you a sense of certainty about your guess. It’s like saying, “I’m 95% sure the average height lies between 5’6” and 5’10.”
A Case Study from TechFlex on User Interface Design
Let’s dive into a practical example. TechFlex, a software company, wanted to redesign their user interface. They had a massive user base of 2.3 million, but they could only test their redesign on a sample of 2,500 users. Using inferential statistics, they implemented hypothesis testing and confidence intervals to gauge how well their results could be generalized.
With these techniques, they could confidently predict how the entire user base might respond to the new design. This is crucial in a business setting where decisions can have significant financial implications. The data pointed them in the right direction, validating their redesign approach.
Importance of Generalizing Sample Results to Larger Populations
But why is generalizing results important? It’s simple: decisions based on accurate data lead to better outcomes. If TechFlex relied solely on feedback from their testing group without considering how those results might a

