Weekly Recap (Nov 2024, part 3)
Description
Full recap: https://blog.stephenturner.us/p/weekly-recap-nov-2024-part-3
This week’s recap highlights pangenome graph construction with nf-core/pangenome, building pangenome graphs with PGGB, benchmarking algorithms for single-cell multi-omics prediction and integration, RNA foundation models, and a Nextflow pipeline for characterizing B cell receptor repertoires from non-targeted bulk RNA-seq data.
Others that caught my attention include benchmarking generative models for antibody design, improved detection of methylation in ancient DNA, differential transcript expression with edgeR, a pipeline for processing xenograft reads from spatial transcriptomics (Xenomake), public RNA-seq datasets and human genetic diversity, a review on bioinformatics approaches to prioritizing causal genetic variants in candidate regions, quantifying constraint in the human mitochondrial genome, a review on sketching with minimizers in genomics, and analysis of outbreak genomic data using split k-mer analysis.
Deep dive
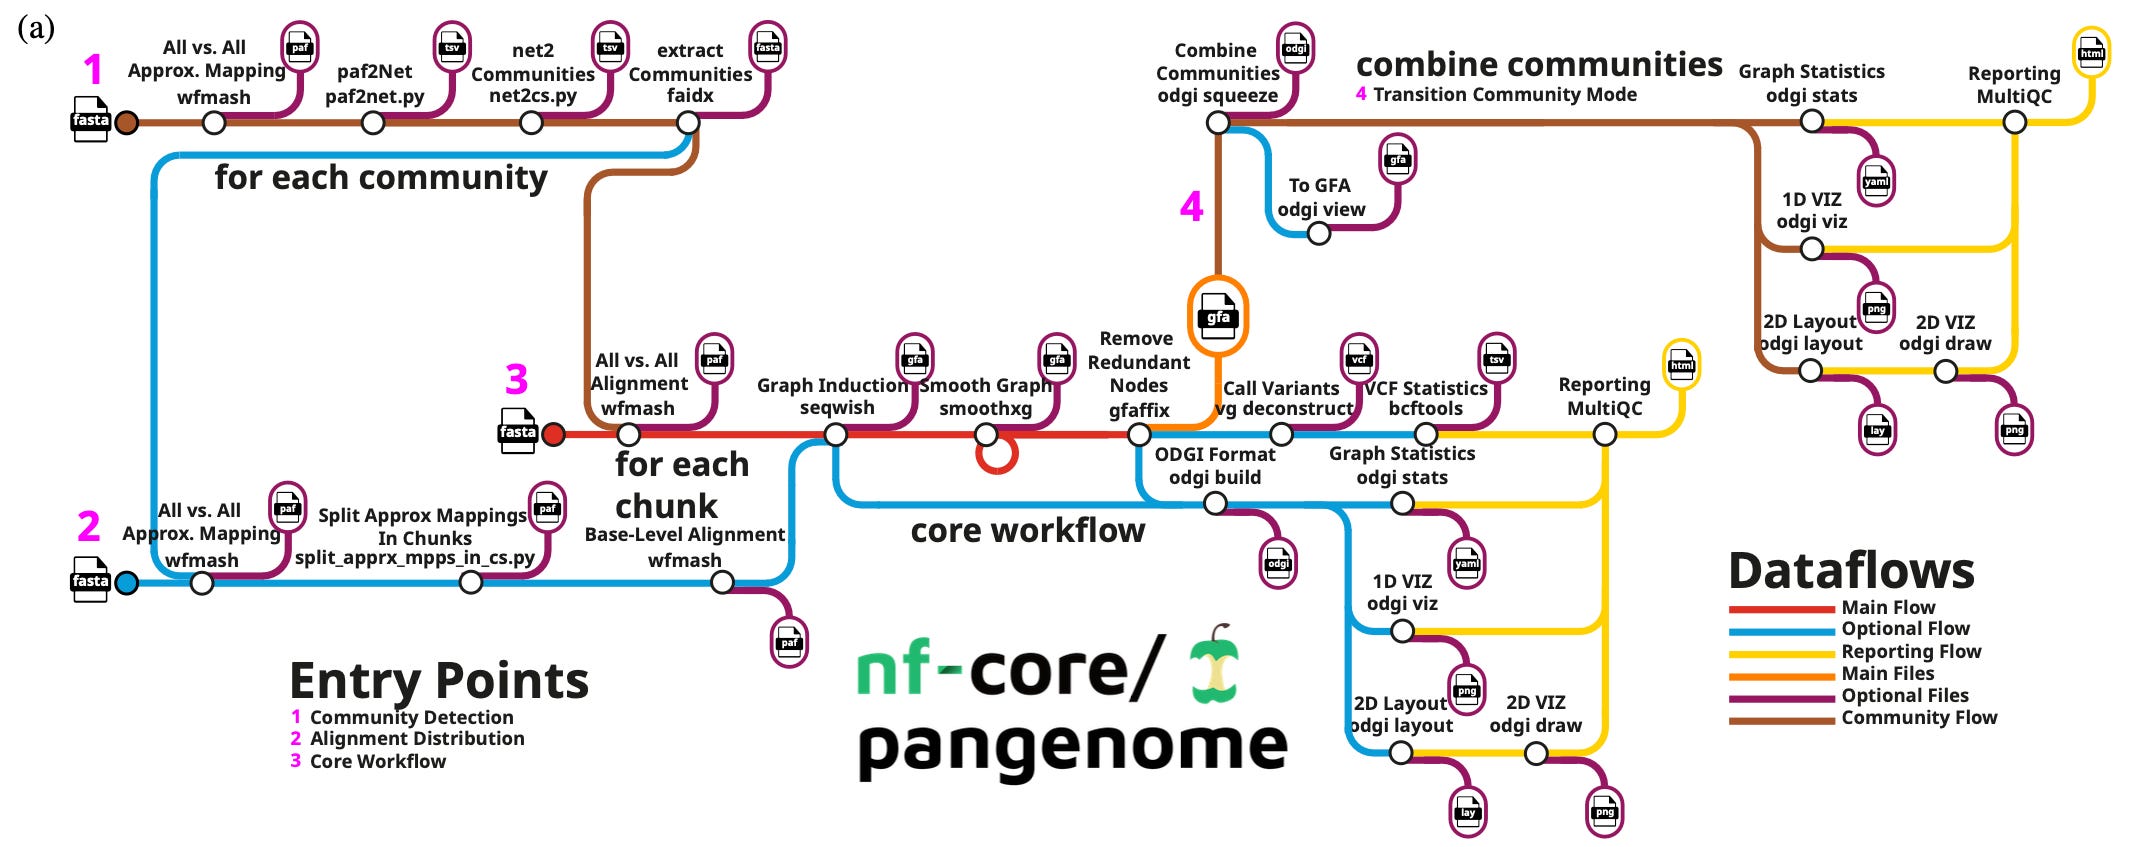
Cluster-efficient pangenome graph construction with nf-core/pangenome
Paper: Heumos, S. et al. Cluster-efficient pangenome graph construction with nf-core/pangenome. Bioinformatics, 2024. DOI: 10.1093/bioinformatics/btae609.
Benchmarking in bioinformatics typically involves some measure of accuracy (precision, recall, F1 score, MCC, ROC, etc.), and compute requirements (CPU time, peak RAM usage, etc.). A metric I’ve been seeing more recently is the carbon footprint of a particular bioinformatics analysis. In the benchmarks performed here (detailed below), the authors calculated the CO2 equivalent (CO2e) emissions for running both nf-core/pangenome and another commonly used tool, showing that nf-core/pangenome took half the time for an analysis without increasing CO2e. It looks like the authors are using the nf-co2footprint plugin to do this.
TL;DR: This paper introduces nf-core/pangenome, a Nextflow-based pipeline for constructing reference-unbiased pangenome graphs, offering improved scalability and computational efficiency compared to existing tools like the PanGenome Graph Builder (PGGB is highlighted next in this post!).
Summary: The nf-core/pangenome pipeline offers a scalable and efficient method for building pangenome graphs by distributing computations across multiple cluster nodes, overcoming the limitations of PGGB, a widely used tool in the field. Pangenome graphs model the collective genomic content across populations, reducing biases associated with traditional reference-based approaches. This work showcases the pipeline’s power by constructing a graph for 1000 chromosome 19 human haplotypes in just three days and processing over 2000 E. coli sequences in ten days—tasks that would take PGGB much longer or fail due to computational limitations. The nf-core/pangenome pipeline emphasizes portability and seamless deployment in high-performance computing (HPC) environments using biocontainers. With these features, it enables population-scale genomic analyses for various organisms, supporting biodiversity and personalized genomics research.
Methodological highlights:
* Uses Nextflow for efficient workflow management and resource distribution, ensuring parallel processing and modular flexibility.
* Avoids reference biases by aligning each sequence against all others with WFMASH, followed by graph induction with SEQWISH and graph simplification with SMOOTHXG.
* The pipeline integrates ODGI for quality control and MultiQC for generating summary reports, ensuring comprehensive analyses.
New tools, data, and resources:
* GitHub repository: https://github.com/nf-core/pangenome.
* Documentation/tests: https://nf-co.re/pangenome.
* Code for the paper: https://github.com/subwaystation/pangenome-paper.
Here’s a talk from last year’s Nextflow summit where Simon Heumos (lead author on this paper) talks about the workflow in detail.
Building pangenome graphs
Paper: Garrison, E. et al. Building pangenome graphs. Nature Methods, 2024. DOI: 10.1038/s41592-024-02430-3 (read free: https://rdcu.be/dXDTo)
The benchmarking paper above discusses nf-core/pangenome in contrast to PGGB, the subject of this paper. This paper was originally published in April 2023, and this updated version of the preprint contains new experimental data. The authors from this paper and the previous nf-core/pangenome paper overlap substantially.
TL;DR: This paper introduces PanGenome Graph Builder (PGGB), a reference-free tool that constructs unbiased pangenome graphs to capture both small and large-scale genetic variations. It avoids reference bias by using all-to-all alignments and provides scalable, lossless representations of genomic data.
Summary: PGGB addresses limitations in traditional genome graph tools, which often rely on a single reference genome, leading to biases and loss of complex variation. The pipeline performs unbiased, reference-free alignments of multiple genomes using the WFMASH tool, followed by graph construction with SEQWISH and graph simplification with SMOOTHXG. This modular approach captures SNPs, structural variants, and large sequence differences across multiple genomes in a unified framework. The study demonstrates PGGB’s ability to scale efficiently, building complex pangenome graphs for datasets such as human chromosome 6 and primate assemblies. PGGB is validated against existing tools, showing superior performance in accurately representing small and structural variants. Its output facilitates downstream analyses such as phylogenetics, population genetics, and comparative genomics, supporting large-scale projects like the Human Pangenome Reference Consortium (HPRC).
Methodological highlights:
* Reference-free alignment: Uses WFMASH for all-to-all sequence alignment, enabling unbiased graph construction.
* Graph induction and normalization: Constructs graphs with SEQWISH and smooths complex motifs with SMOOTHXG, improving downstream compatibility.
* Sparsified alignment approach: Implements random sparsification to reduce computational costs while maintaining accurate genome relationships.
New tools, data, and resources:
* GitHub repository: https://github.com/pangenome/pggb.
* Data: Example pangenomes and validation datasets available at https://doi.org/10.5281/zenodo.7937947.
* Documentation: https://pggb.readthedocs.io.
Benchmarking algorithms for single-cell multi-omics prediction and integration
Paper: Hu, Y. et al. Benchmarking algorithms for single-cell multi-omics prediction and integration. Nature Methods, 2024. DOI: 10.1038/s41592-024-02429-w. (Read free: https://rdcu.be/dW01n).
The idea behind integration of single cell data is to combine multiple types of single cell omics data (genomics, transcriptomics, epigenomics, etc) to get a more complete understanding of individual cell states. An example: maybe you use Seurat to map scRNA-seq data onto something like scATAC-seq obtained from the same tissue to identify nearest neighbor cells for a given cell across data types, and use the mapping to predict protein abundance or chromatin accessibility. This paper benchmarks many different integration approaches, making the distinction between vertical integration (different modalities), horizontal integration (batch correction across datasets), and mosaic integration (multi-omic datasets sharing one type of omics data).
TL;DR: This study benchmarks 14 prediction algorithms and 18 integration algorithms for single-cell multi-omics, highlighting top performers such as totalVI, scArches, LS_Lab, and UINMF. It also provides a framework for selecting optimal algorithms based on specific prediction and integration tasks.
Summary: Single-cell multi-omics technologies enable simultaneous profiling of RNA expression, protein abundance, and chromatin accessibility. This paper evaluates 14 algorithms that predict protein abundance or chromatin accessibility from scRNA-seq data and 18 algorithms for multi-omics integration. totalVI and scArches consistently excel in protein abundance prediction, while LS_Lab demonstrates superior performance in predicting chromatin accessibility. For multi-omics integration tasks, Seurat and MOJITOO lead in vertical integration, while UINMF and totalVI excel in horizontal and mosaic integration scenari

