Chart of the Day: AMAT 'Bull Flag' Pattern
Description
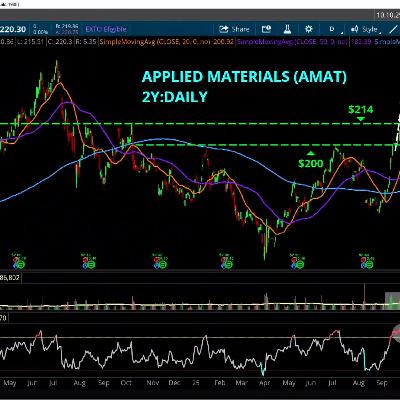
Semiconductor equipment manufacturer Applied Materials (AMAT) hit 52-week highs earlier this week. Kevin Horner examines the 30-day trading range, highlighting $208 support with $226 upside resistance. On a 2-year chart, Kevin shows the "bull-flag" pattern taking shape and what it means relative to the all-time highs reached back in July of 2024. He signals the "overbought" conditions being displayed on the charts RSI momentum study as a possible bullish indicator for the stock.
======== Schwab Network ========
Empowering every investor and trader, every market day.
Subscribe to the Market Minute newsletter - https://schwabnetwork.com/subscribe
Download the iOS app - https://apps.apple.com/us/app/schwab-network/id1460719185
Download the Amazon Fire Tv App - https://www.amazon.com/TD-Ameritrade-Network/dp/B07KRD76C7
Watch on Sling - https://watch.sling.com/1/asset/191928615bd8d47686f94682aefaa007/watch
Watch on Vizio - https://www.vizio.com/en/watchfreeplus-explore
Watch on DistroTV - https://www.distro.tv/live/schwab-network/
Follow us on X – / schwabnetwork
Follow us on Facebook – / schwabnetwork
Follow us on LinkedIn - / schwab-network
About Schwab Network - https://schwabnetwork.com/about

