Chart of the Day: AXP 'Express Ride to the Upside'
Description
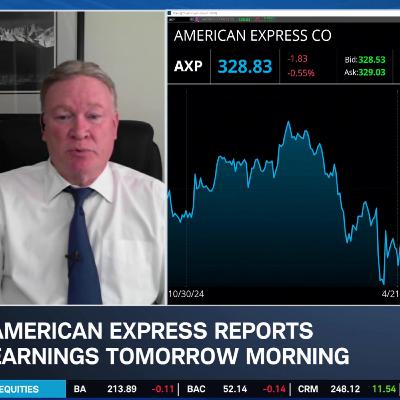
Ahead of upcoming earnings, Ben Watson breaks down the chart of American Express (AXP) looking at the base over the last 5 days with upside resistance at $338. On a 1-year chart, he's observing an ascending triangle pattern with a small tail-off on RSI momentum which he calls "unusual" with the stock at a steady uptrend. Ben posits the consumer spending trends could be something to watch.
======== Schwab Network ========
Empowering every investor and trader, every market day.
Subscribe to the Market Minute newsletter - https://schwabnetwork.com/subscribe
Download the iOS app - https://apps.apple.com/us/app/schwab-network/id1460719185
Download the Amazon Fire Tv App - https://www.amazon.com/TD-Ameritrade-Network/dp/B07KRD76C7
Watch on Sling - https://watch.sling.com/1/asset/191928615bd8d47686f94682aefaa007/watch
Watch on Vizio - https://www.vizio.com/en/watchfreeplus-explore
Watch on DistroTV - https://www.distro.tv/live/schwab-network/
Follow us on X – / schwabnetwork
Follow us on Facebook – / schwabnetwork
Follow us on LinkedIn - / schwab-network
About Schwab Network - https://schwabnetwork.com/about

