


")
Mapped: GDP Growth by U.S. State (1990-2024)
Description
Real GDP Growth by U.S. State (1990-2024)
See visuals like this from many other data creators on our Voronoi app. Download it for free on iOS or Android and discover incredible data-driven charts from a variety of trusted sources.
Key Takeaways
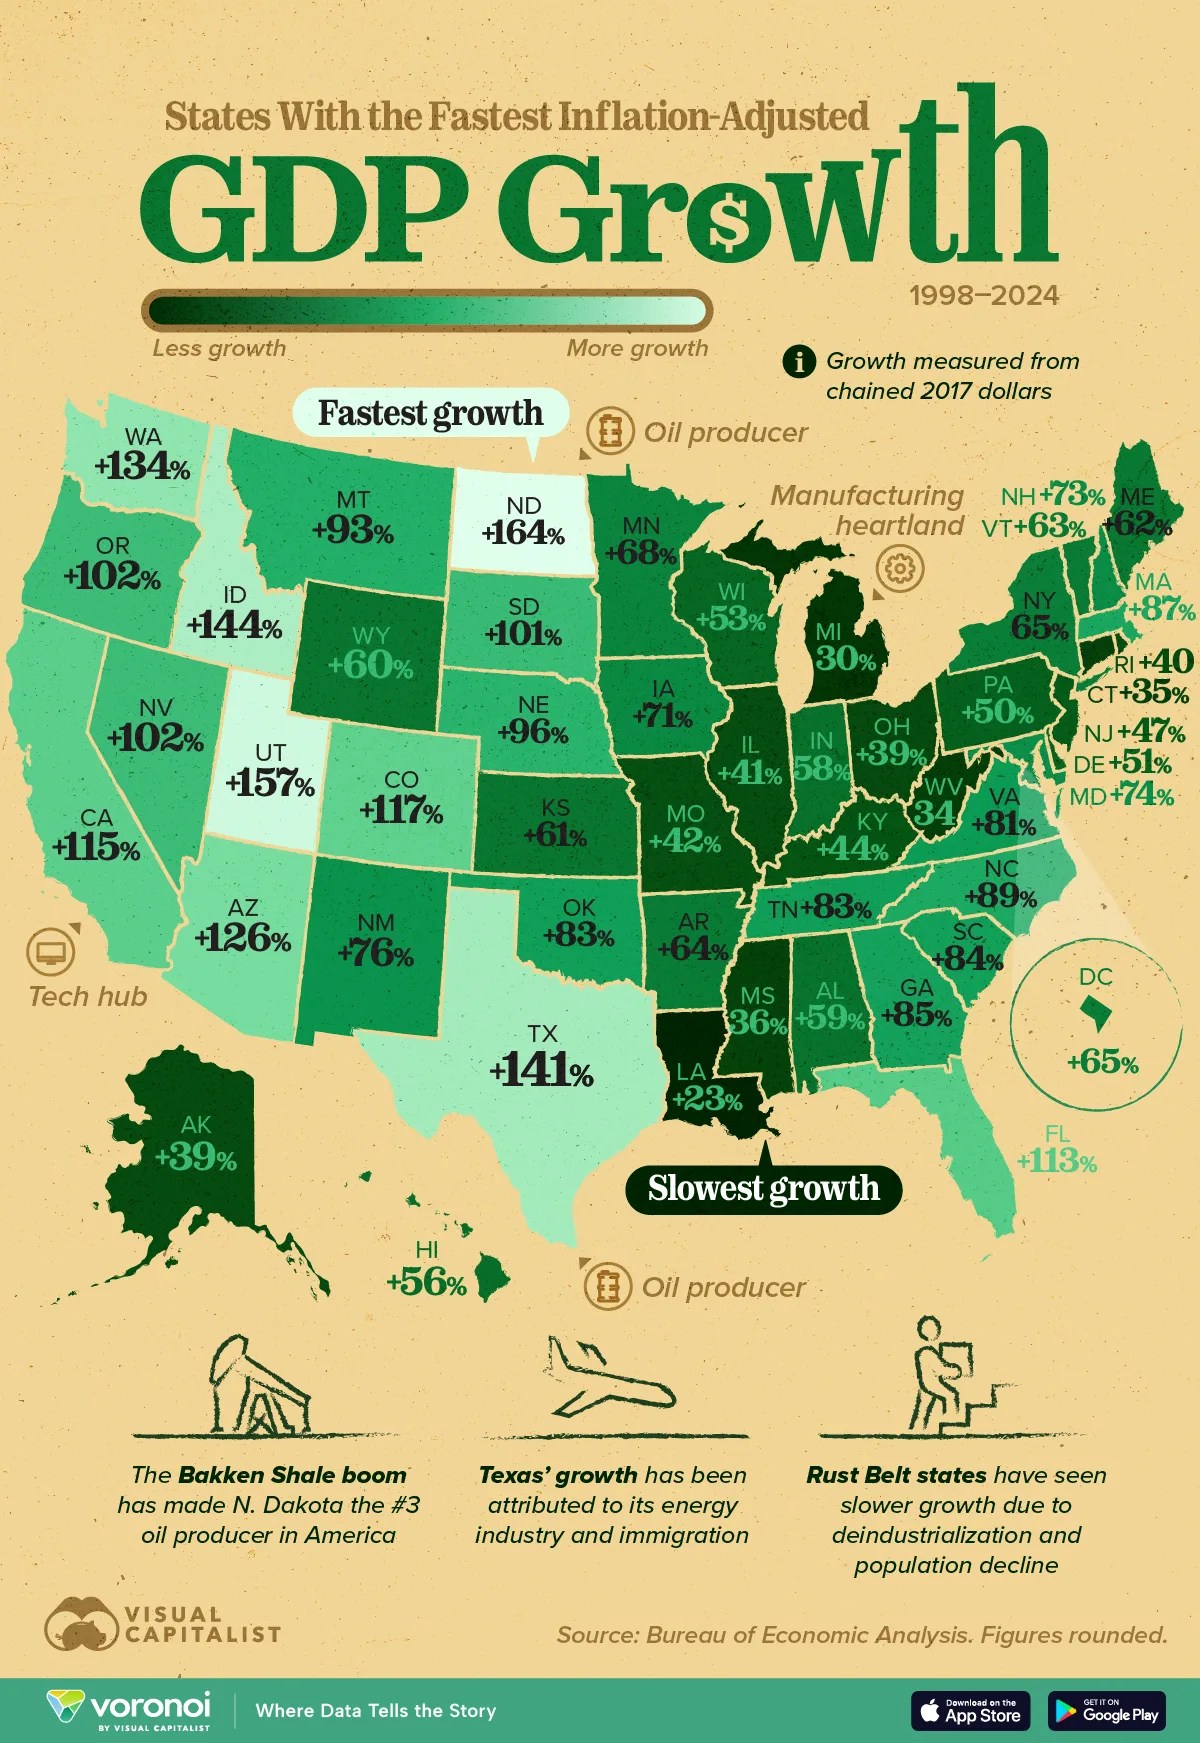
- North Dakota (+164%) and Texas (+141%) posted the most real GDP growth since 1990, powered largely by the shale boom.
- Several Rust Belt and industrial states—including Louisiana, Michigan, and West Virginia—lagged with growth under 35% over the same period.
The 1990s were a different time. Dial-up internet, gas costing a dollar, and many states still leaning on manufacturing.
Even then, new tech clusters and improved drilling methods were starting to reshape the map, setting up today’s energy-rich and tech-focused states for the strongest economies.
The visualization ranks all 50 states and the District of Columbia by inflation-adjusted GDP growth between 1990–2024. Data for real GDP growth by U.S. state is sourced from Bureau of Economic Analysis.
 Real GDP growth measured from chained 2017 dollars.
America’s Shale Boom in One Map
North Dakota’s economy more than doubled thanks to the Bakken shale boom, which lifted its real output by 164%—twice the U.S. average.
Texas, already the nation’s largest oil-producing state, followed closely with 141% growth.
| Rank | State | State Code | GDP Growth (1998–2024) | CAGR | 2024 GDP (Billions) |
|---|---|---|---|---|---|
| 1 | North Dakota | ND | 164% | 3.8% | $80,058 |
| 2 | Utah | UT | 157% | 3.7% | $299,471 |
| 3 | Idaho | ID | 144% | 3.5% | $129,018 |
| 4 | Texas | TX | 141% | 3.4% | $2,769,766 |
| 5 | Washington | WA | 134% | 3.3% | $856,014 |
| 6 | Arizona | AZ | 126% | 3.2% | $570,089 |
| 7 | Colorado | CO | 117% | 3.0% | $557,633 |
| 8 | California | CA | 115% | 3.0% | $4,048,108 |
| 9 | Florida | FL | 113% | 3.0% | $1,726,710 |
| 10 | Oregon | OR | 102% | 2.7% | $330,250 |
| 11 | Nevada | NV | 102% | 2.7% | $269,011 |
| 12 | South Dakota | SD | 101% | 2.7% | $76,796 |
| 13 | Nebraska | NE | 96% | 2.6% | $189,243 |
| 14 | Montana | MT | 93% | 2.6% | $78,441 |
| 15 | North Carolina | NC | 89% | 2.5% | $844,209 |
| 16 | Massachusetts | MA | 87% | 2.4% | $778,523 |
| 17 | Georgia | GA | 85% | 2.4% | $881,508 |
| 18 | South Carolina | SC | 84% | 2.4% | $357,074 |
| 19 | Oklahoma | OK | 83% | 2.4% | $263,695 |
| 20 | Tennessee | TN | 83% | 2.3% | $561,201 |
| 21 | Virginia | VA | 81% | 2.3% | $761,734 |
| 22 | New Mexico | NM | 76% | 2.2% | $147,085 |
| 23 | Maryland | MD | 74% | 2.2% | $546,028 |
| 24 | New Hampshire | NH | 73% | 2.1% | $119,337 |
| 25 | Iowa | IA | 71% | 2.1% | $265,795 |
| 26 | Minnesota | MN | 68% | 2.0% | $507,688 |
| 27 | New York | NY | 65% | 2.0% | $2,322,139 |
| 28 | District of Columbia | DC | 65% | 1.9% | $184,298 |


