


Mapped: U.S. Incarceration Rates by State
Description
Mapped: U.S. Incarceration Rates by State
See visuals like this from many other data creators on our Voronoi app. Download it for free on iOS or Android and discover incredible data-driven charts from a variety of trusted sources.
Key Takeaways
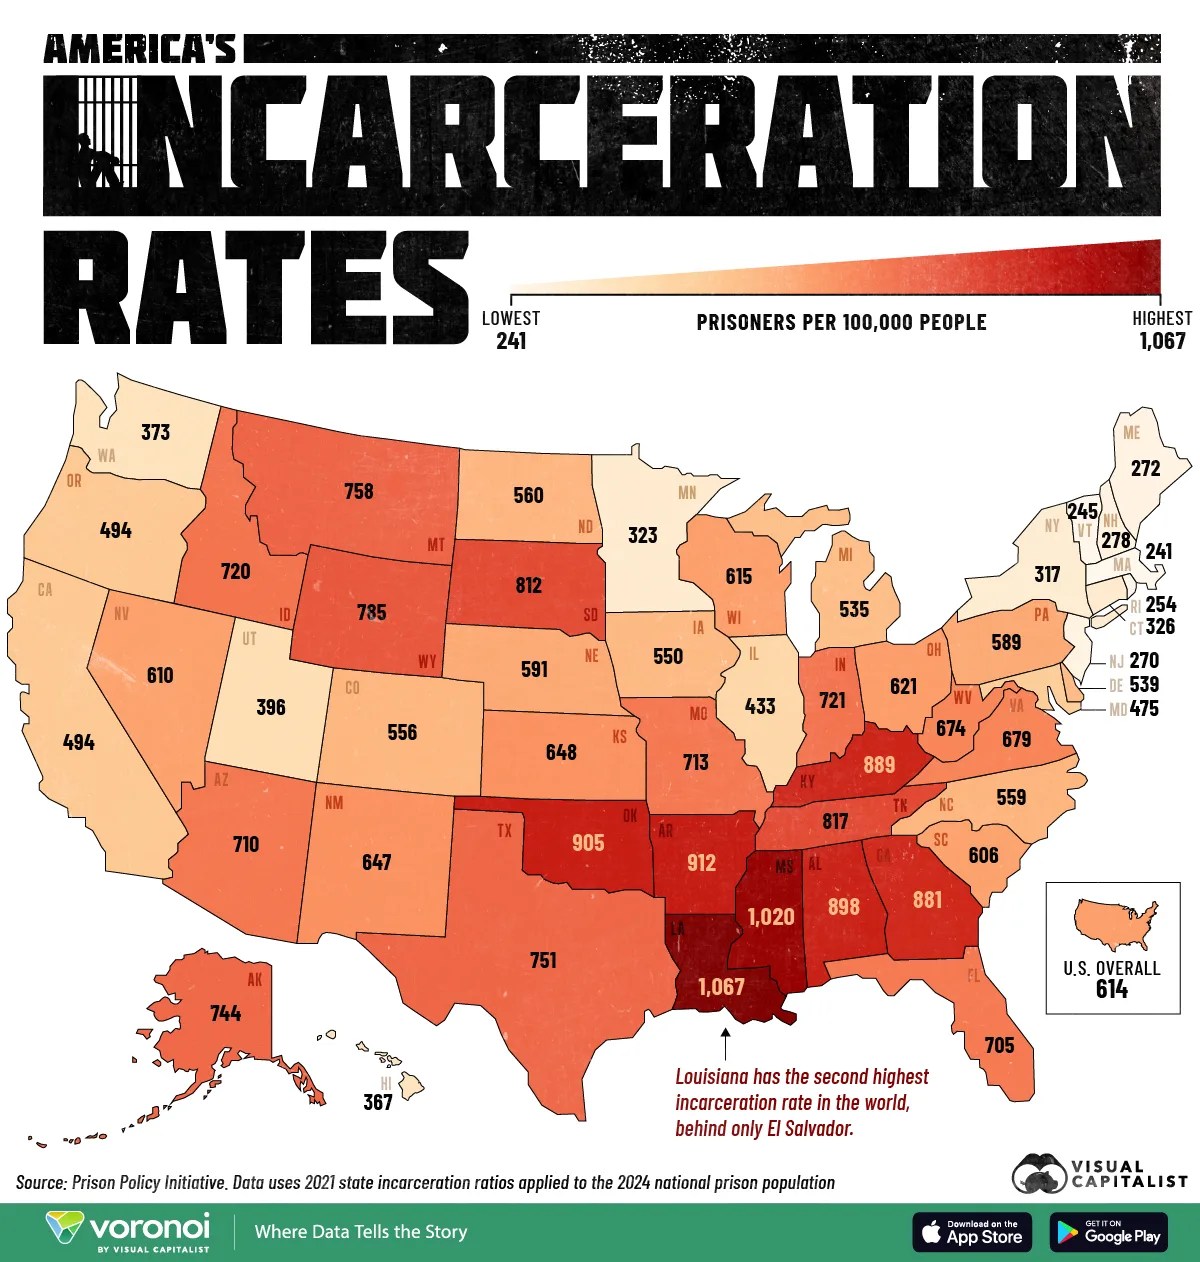
- The U.S. incarceration rate stands at 614 per 100,000 people, one of the world’s highest.
- Southern states have the most prisoners per capita, while Massachusetts ranks lowest nationally.
Millions of prisoners are detained in America, but incarceration rates vary widely by state.
Overall, detaining inmates costs an estimated $182 billion each year across 1,566 state prisons, 3,116 local prisons, and 98 federal facilities. Despite being the world’s largest economy, America has the fourth-highest incarceration rate globally.
This graphic shows prisoners per 100,000 people by state, based on data from the Prison Policy Initiative.
Incarceration Rates Are Highest in the South
Below, we rank states by incarceration rates, using 2021 state-level data applied to the 2024 national prison population:
| State | Incarceration Rate (per 100,000 people) |
|---|---|
| Louisiana | 1,067 |
| Mississippi | 1,020 |
| Arkansas | 912 |
| Oklahoma | 905 |
| Alabama | 898 |
| Kentucky | 889 |
| Georgia | 881 |
| Tennessee | 817 |
| South Dakota | 812 |
| Wyoming | 785 |
| Montana | 758 |
| Texas | 751 |
| Alaska | 744 |
| Indiana | 721 |
| Idaho | 720 |
| Missouri | 713 |
| Arizona | 710 |
| Florida | 705 |
| Virginia | 679 |
| West Virginia | 674 |
| Kansas | 648 |
| New Mexico | 647 |
| Ohio | 621 |
| Wisconsin | 615 |
| Nevada | 610 |
| South Carolina | 606 |
| Nebraska | 591 |
| Pennsylvania | 589 |
| North Dakota | 560 |
| North Carolina | 559 |
| Colorado | 556 |
| Iowa | 550 |
| Delaware | 539 |
| Michigan | 535 |
| Oregon | 494 |
| California | 494 |
| Maryland | 475 |
| Illinois | 433 |
| Utah | 396 |
| Washington | 373 |
| Hawaii | 367 |
| Connecticut | 326 |
| Minnesota | 323 |
| New York | 317 |
| New Hampshire | 278 |
| Maine | 272 |
| New Jersey | 270 |
| Rhode Island | 254 |
| Vermont | 245 |
| Massachusetts | 241 |
| U.S. Overall | 614 |
With 1,067 prisoners per 100,000 people Louisiana has a staggeringly high rate of people behind bars.
Not only is this nearly double the national average, it is more than 12 times higher than in Canada. Despite being the “incarceration capital of the world”, it has the second-highest murder rate in the country, after Mississippi.
Making matters worse, several prisoners, including juveniles, face life sentences in Louisiana without the chance of parole.
As we can see, Southern states make up eight of the 10 highest incarceration rates, disproportionately impacting people of color. Over the past 25 years, penalties for non-violent offenses have also become increasingly severe, with detainees serving longer sentences.
By contrast, Massachusetts, Vermont, and Rhode Island have the lowest rates in the nation—however, they remain higher than most countries.
Learn More on the Voronoi App 
To learn more about this topic, check out this graphic on the cost per prisoner by U.S. state.


 United States
