


Ranked: Countries With the Most Years in Poor Health
Description
Ranked: Countries With the Most Years in Poor Health
See visuals like this from many other data creators on our Voronoi app. Download it for free on iOS or Android and discover incredible data-driven charts from a variety of trusted sources.
Key Takeaways
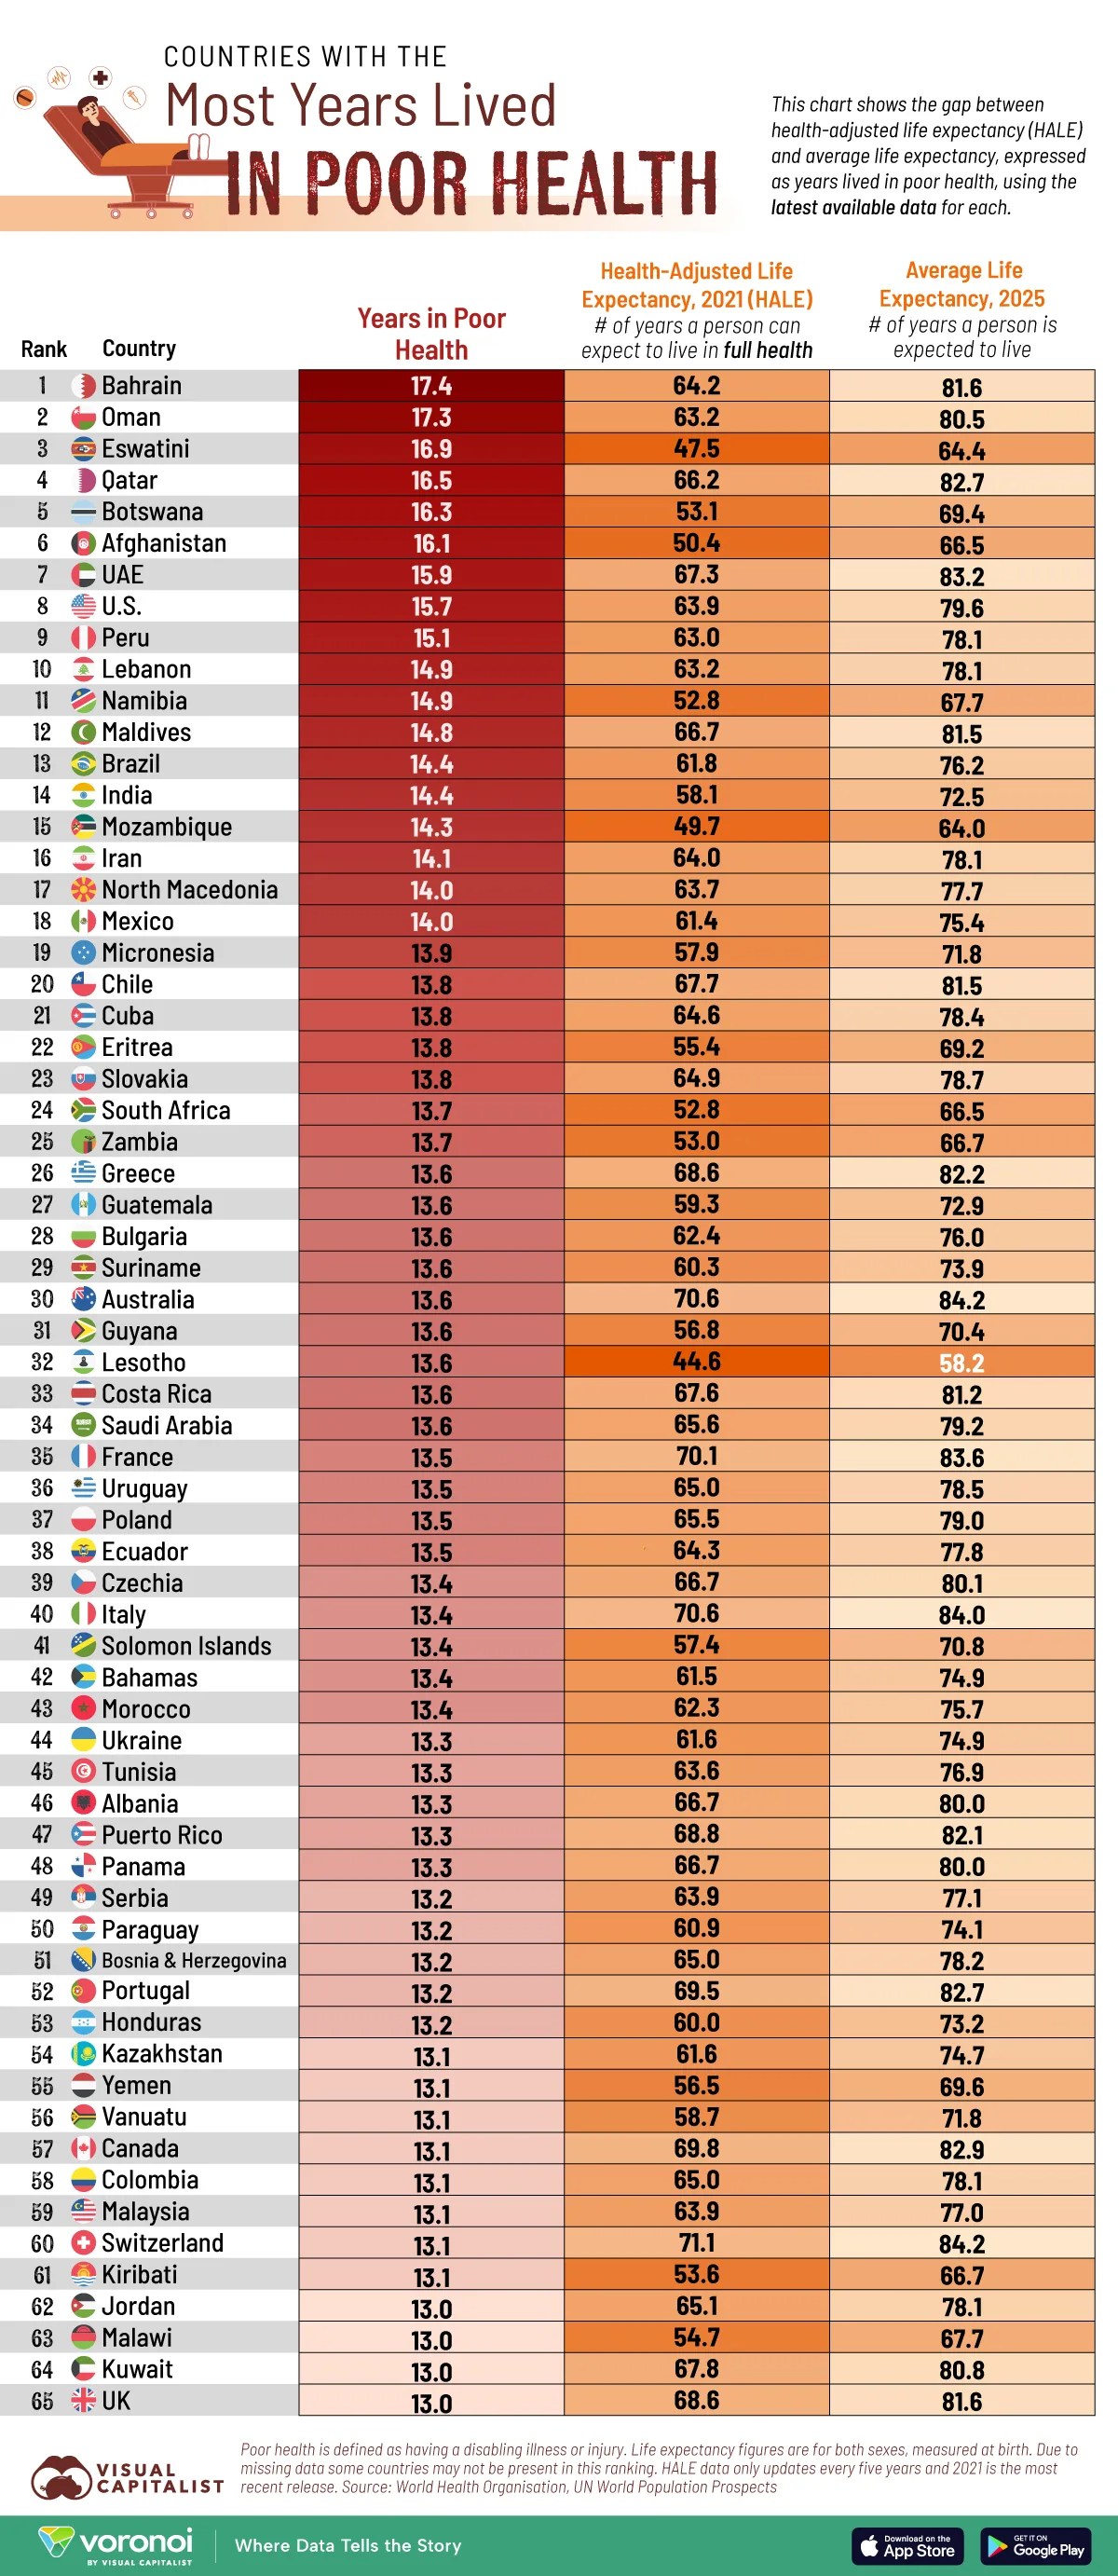
- When measuring the gap between average life expectancy and health-adjusted life expectancy (HALE), wealthy Gulf states dominate the worst performers.
- On average, residents in Bahrain, Oman, Qatar, and the UAE all spend 16–17 years in poor health.
- Another rich country, the U.S., ranks eighth by this metric, with Americans spending nearly 16 of their 80 expected years in poor health.
Many people are living longer—but not necessarily healthier—lives.
This visualization ranks countries by the number of years their citizens can expect to live in poor health, calculated as the gap between average life expectancy and health-adjusted life expectancy.
Skip to the second-last section for a full explanation of what health-adjusted life expectancy (HALE) is, and why it matters.
HALE data (for the year 2021) is sourced from the World Bank, via Our World in Data. Average life expectancy is from 2025 estimates UN World Population Prospects.
Together they reveal how disease, disability, and chronic conditions shape the quality—not just the quantity—of our lives.
 Important information:
1. Poor health is defined as having a disabling illness or injury.
2. Life expectancy figures are for both sexes, measured at birth.
3. HALE data only updates every five years and 2021 is the most recent release.
4. While the comparison isn’t perfect, shows broader regional patterns in healthcare.
5. Due to missing data some countries may not be present in this ranking.
The Difference Between Living Longer and Living Healthier
Oil wealth appears genuinely toxic to health outcomes.
Nearly every Middle Eastern petrostate (Bahrain, Oman, Qatar, UAE, Kuwait) appears in this worst-performers list.
Bahrain (17.4 years), Oman (17.3), Qatar (16.5), and the UAE (15.9) all post sizable gaps despite having robust health-care budgets.
| Rank | Country | Region | Years in Poor Health | HALE, 2021 | Average Life Expectancy, 2025 |
|---|---|---|---|---|---|
| 1 |  Bahrain Bahrain | Asia | 17.4 | 64.2 | 81.6 |
| 2 |  Oman Oman | Asia | 17.3 | 63.2 | 80.5 |
| 3 |  Eswatini Eswatini | Africa | 16.9 | 47.5 | 64.4 |
| 4 |  Qatar Qatar | Asia | 16.5 | 66.2 | 82.7 |
| 5 |  Botswana Botswana | Africa | 16.3 | 53.1 | 69.4 |
| 6 |  Afghanistan Afghanistan | Asia | 16.1 | 50.4 | 66.5 |
| 7 |  UAE UAE | Asia | 15.9 | 67.3 | 83.2 |
| 8 |  U.S. U.S. | Northern America | 15.7 | 63.9 | 79.6 |
| 9 |  Peru Peru | Southern America | 15.1 | 63.0 | 78.1 |
| 10 |  Lebanon Lebanon | Asia | 14.9 | 63.2 | 78.1 |
| 11 |  Namibia Namibia | Africa | 14.9 | 52.8 | 67.7 |
| 12 |  Maldives Maldives | Asia | 14.8 | 66.7 | 81.5 |
| 13 |  Brazil Brazil | Southern America | 14.4 | 61.8 | 76.2 |
| 14 |  India India | Asia | 14.4 | 58.1 | 72.5 |
| 15 |  Mozambique Mozambique | Africa | 14.3 | 49.7 |


