


Visualizing U.S. Flight Cancellations Over the Shutdown
Description
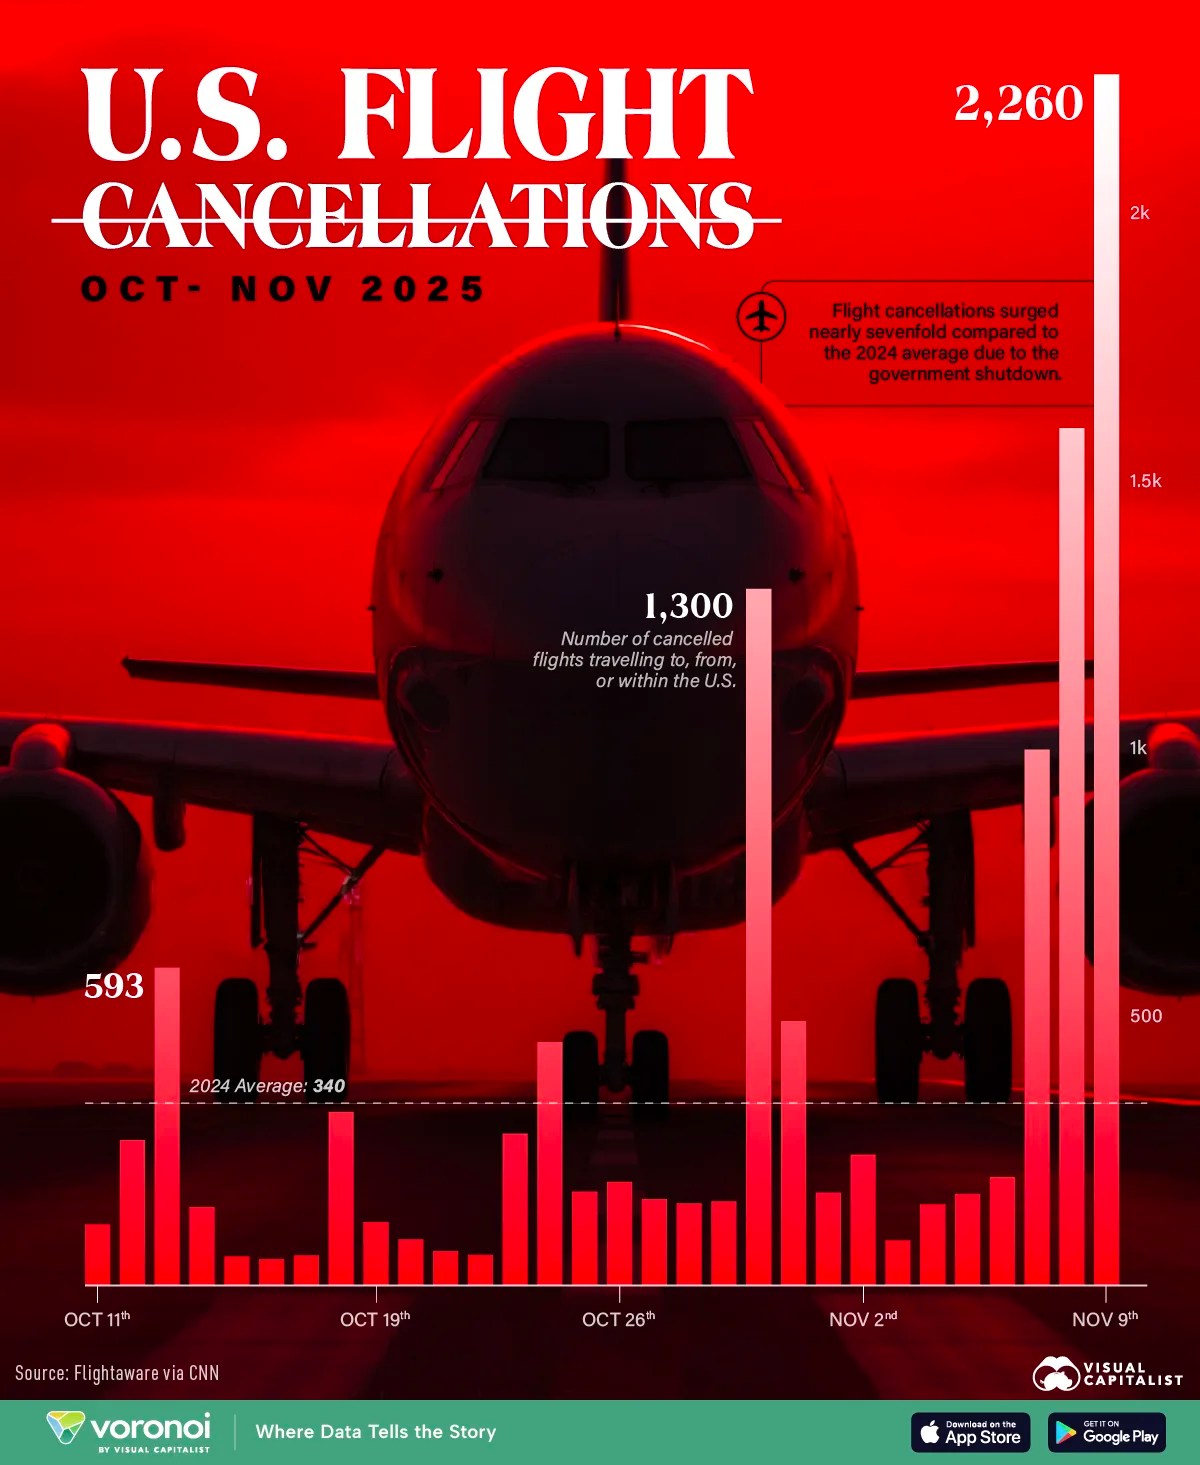
U.S. Flight Cancellations Over the Government Shutdown
See visuals like this from many other data creators on our Voronoi app. Download it for free on iOS or Android and discover incredible data-driven charts from a variety of trusted sources.
Key Takeaways
- During the longest U.S. government shutdown on record, flight cancellations jumped to 2,260 on November 9th, nearly seven times higher than the 2024 average.
- Major U.S. airlines are estimated to lose between $150 and $200 million in operating income due to the 43-day shutdown.
Over five million travelers were impacted by the U.S. government shutdown given flight-reduction orders across the country.
While the average number of daily flight cancellations in 2024 was 340, it skyrocketed to 2,260 on November 9th. Adding to this, air traffic controllers were already facing a shortage of nearly 4,000 fully certified personnel ahead of the shutdown.
This graphic shows the surge in flight cancellations over the government shutdown, based on data from Flightaware via CNN.
U.S. Flight Cancellations Skyrocket
Below, we show the number of flight cancellations over the longest shutdown in U.S. history, causing billions of dollars of damage to the U.S. travel industry:
| Date | Number of cancelled flights travelling to, from, or within the U.S. |
|---|---|
| Nov 9 | 2,260 |
| Nov 8 | 1,600 |
| Nov 7 | 1,000 |
| Nov 6 | 202 |
| Nov 5 | 171 |
| Nov 4 | 151 |
| Nov 3 | 84 |
| Nov 2 | 244 |
| Nov 1 | 173 |
| Oct 31 | 493 |
| Oct 30 | 1,300 |
| Oct 29 | 157 |
| Oct 28 | 153 |
| Oct 27 | 161 |
| Oct 26 | 193 |
| Oct 25 | 175 |
| Oct 24 | 454 |
| Oct 23 | 283 |
| Oct 22 | 57 |
| Oct 21 | 64 |
| Oct 20 | 86 |
| Oct 19 | 118 |
| Oct 18 | 324 |
| Oct 17 | 56 |
| Oct 16 | 49 |
| Oct 15 | 54 |
| Oct 14 | 146 |
| Oct 13 | 593 |
| Oct 12 | 271 |
| Oct 11 | 114 |
| 2024 Average | 340 |
After the Federal Aviation Administration ordered a 10% reduction in flights across 40 major airports, Delta Air Lines was among the hardest hit.
Over the last few days of the shutdown, as many as 34% of all Delta flights were delayed, while 11% were cancelled. American Airlines saw the second-highest number of flights impacted, with more than a third delayed.
Overall, airports in Chicago, New York, and Atlanta were among the most affected. Major airlines are expected to see up to a $200 million hit in operating income, while regional airlines could face up to $100 million.
Making matters worse, the U.S. travel industry is estimated to lose $5.7 billion in international tourism spending this year compared to 2024, largely driven by a decline in Canadian travelers.
Learn More on the Voronoi App 
To learn more about this topic, check out this graphic on the world’s busiest airports.


 United States
