DiscoverEA Forum Podcast (All audio)“US public attitudes towards artificial intelligence (Wave 2 of Pulse)” by Jamie E, David_Moss
“US public attitudes towards artificial intelligence (Wave 2 of Pulse)” by Jamie E, David_Moss

“US public attitudes towards artificial intelligence (Wave 2 of Pulse)” by Jamie E, David_Moss

Update: 2025-09-12
Share

Description

This report is the second in a sequence detailing the results of Wave 2 of the Pulse project by Rethink Priorities (RP). Pulse is a large-scale survey of US adults aimed at tracking and understanding public attitudes towards effective giving and multiple impactful cause areas over time. Wave 2 of Pulse was fielded between February and April of 2025 with ~5600 respondents.[1] Results from our first wave of Pulse, fielded from July-September of 2024, can be found here, with the forum sequence version here.

This part of the Wave 2 sequence focuses on attitudes towards AI.

Findings at a glance

Survey features:

  • Wave 2 of Rethink Priorities’ Pulse project surveyed ~5,600 US adults between February and April 2025, following up on Wave 1 (July–September 2024).
  • Results were poststratified to be representative of the US adult population with respect to Age, Sex, Income, Racial identification, Educational attainment, State and [...]

---

Outline:

(00:52 ) Findings at a glance

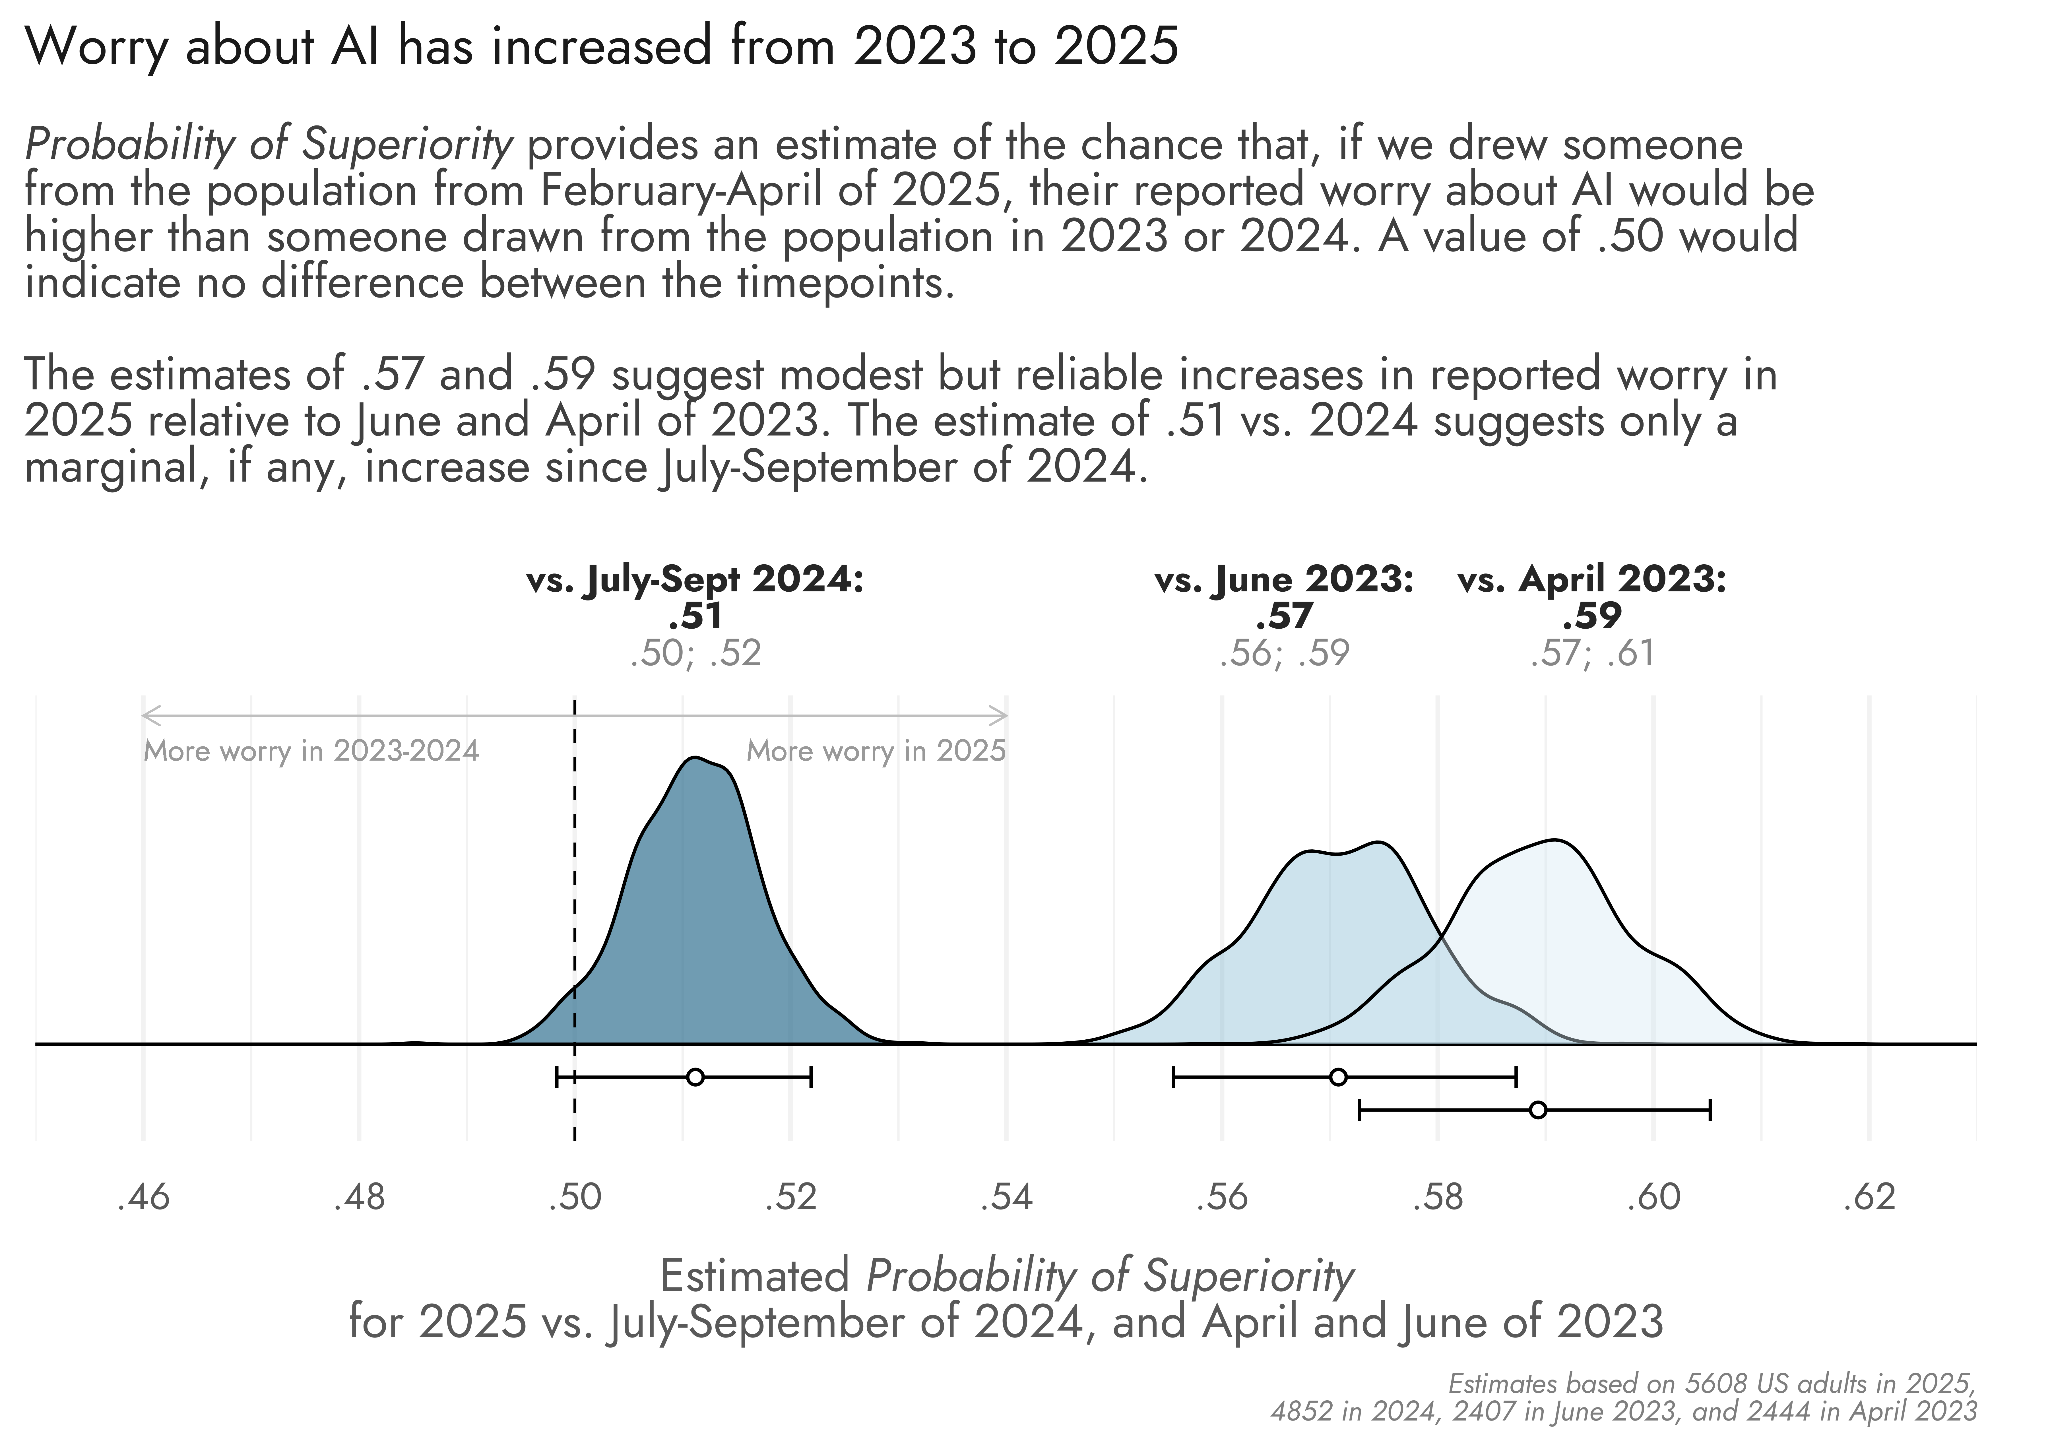
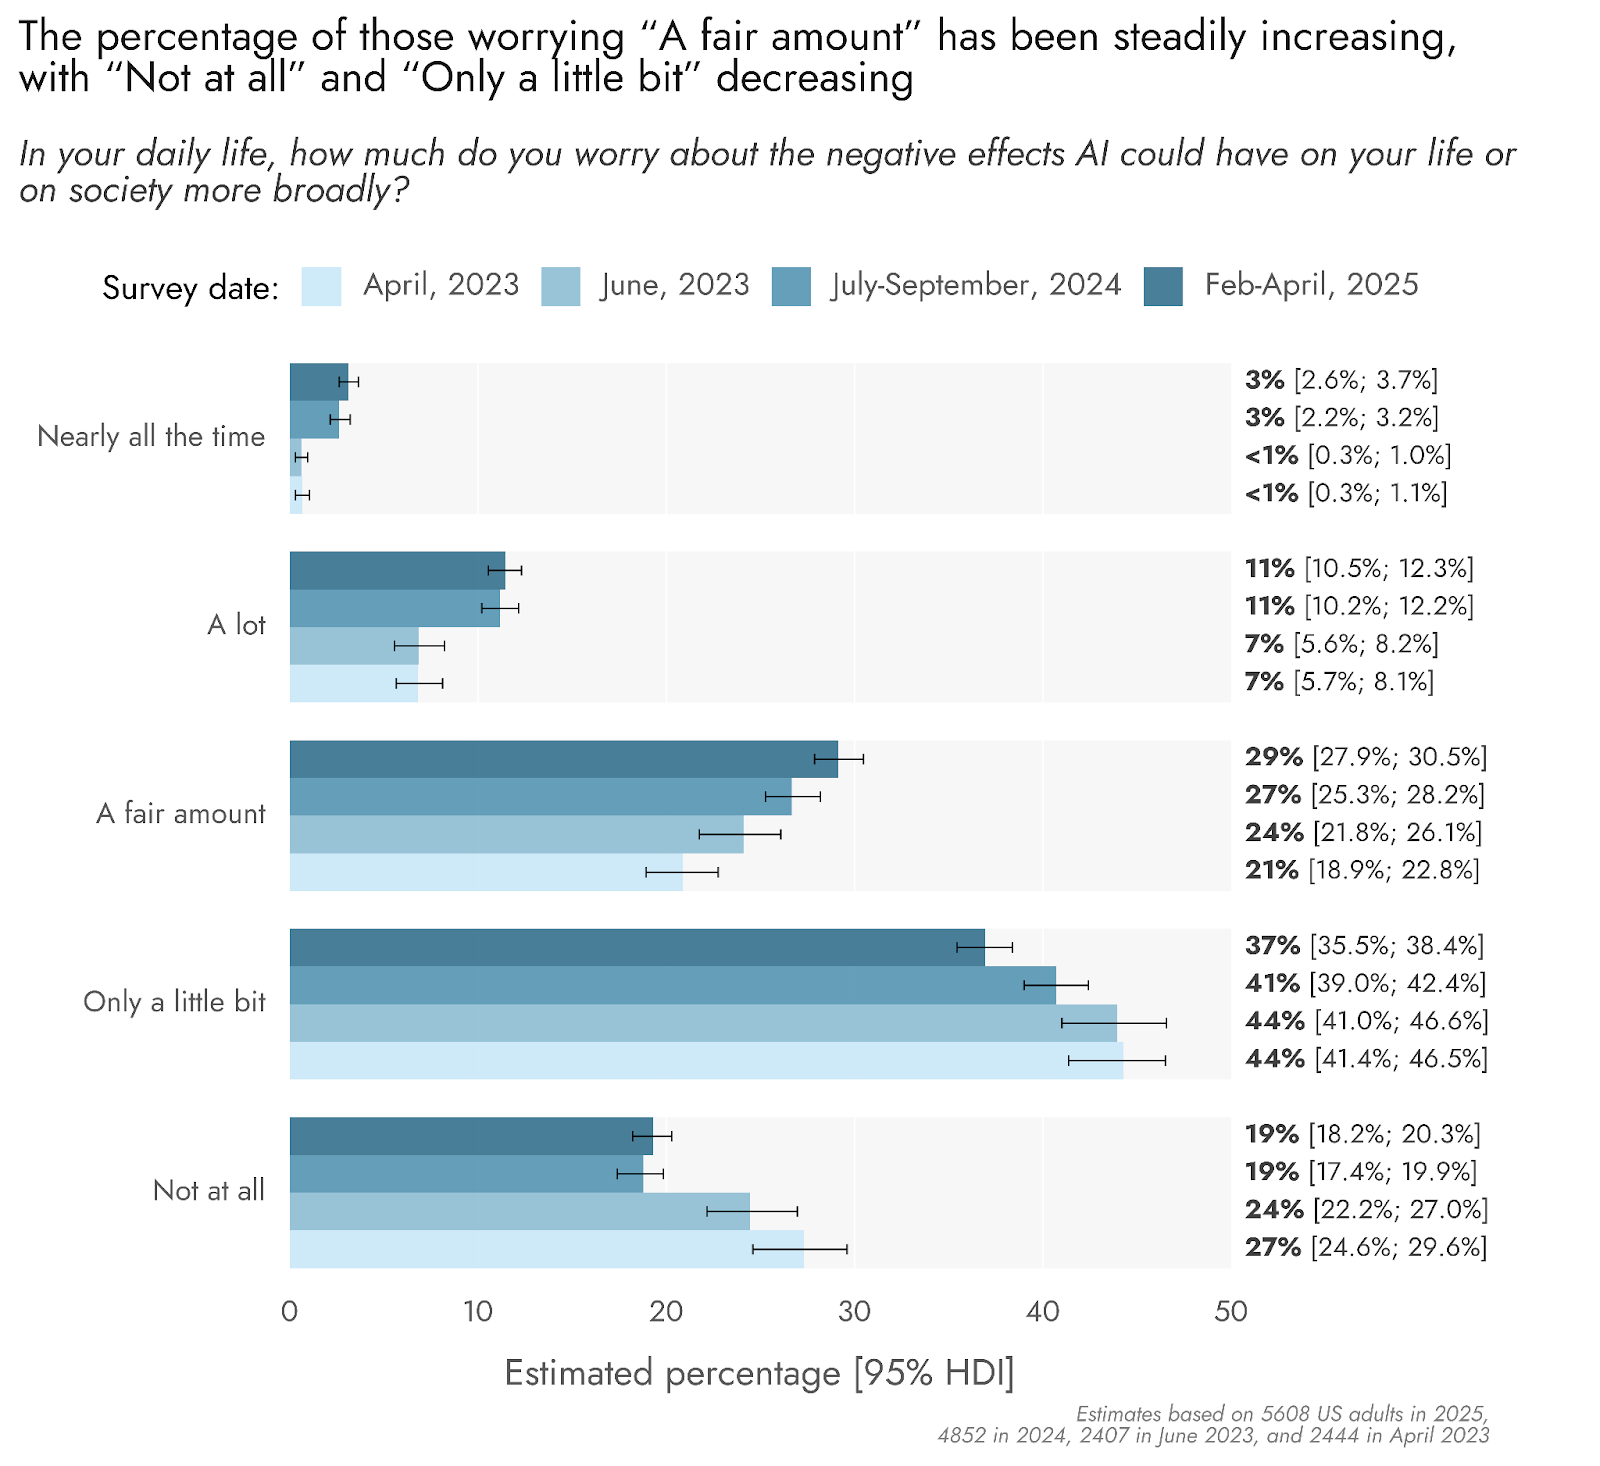
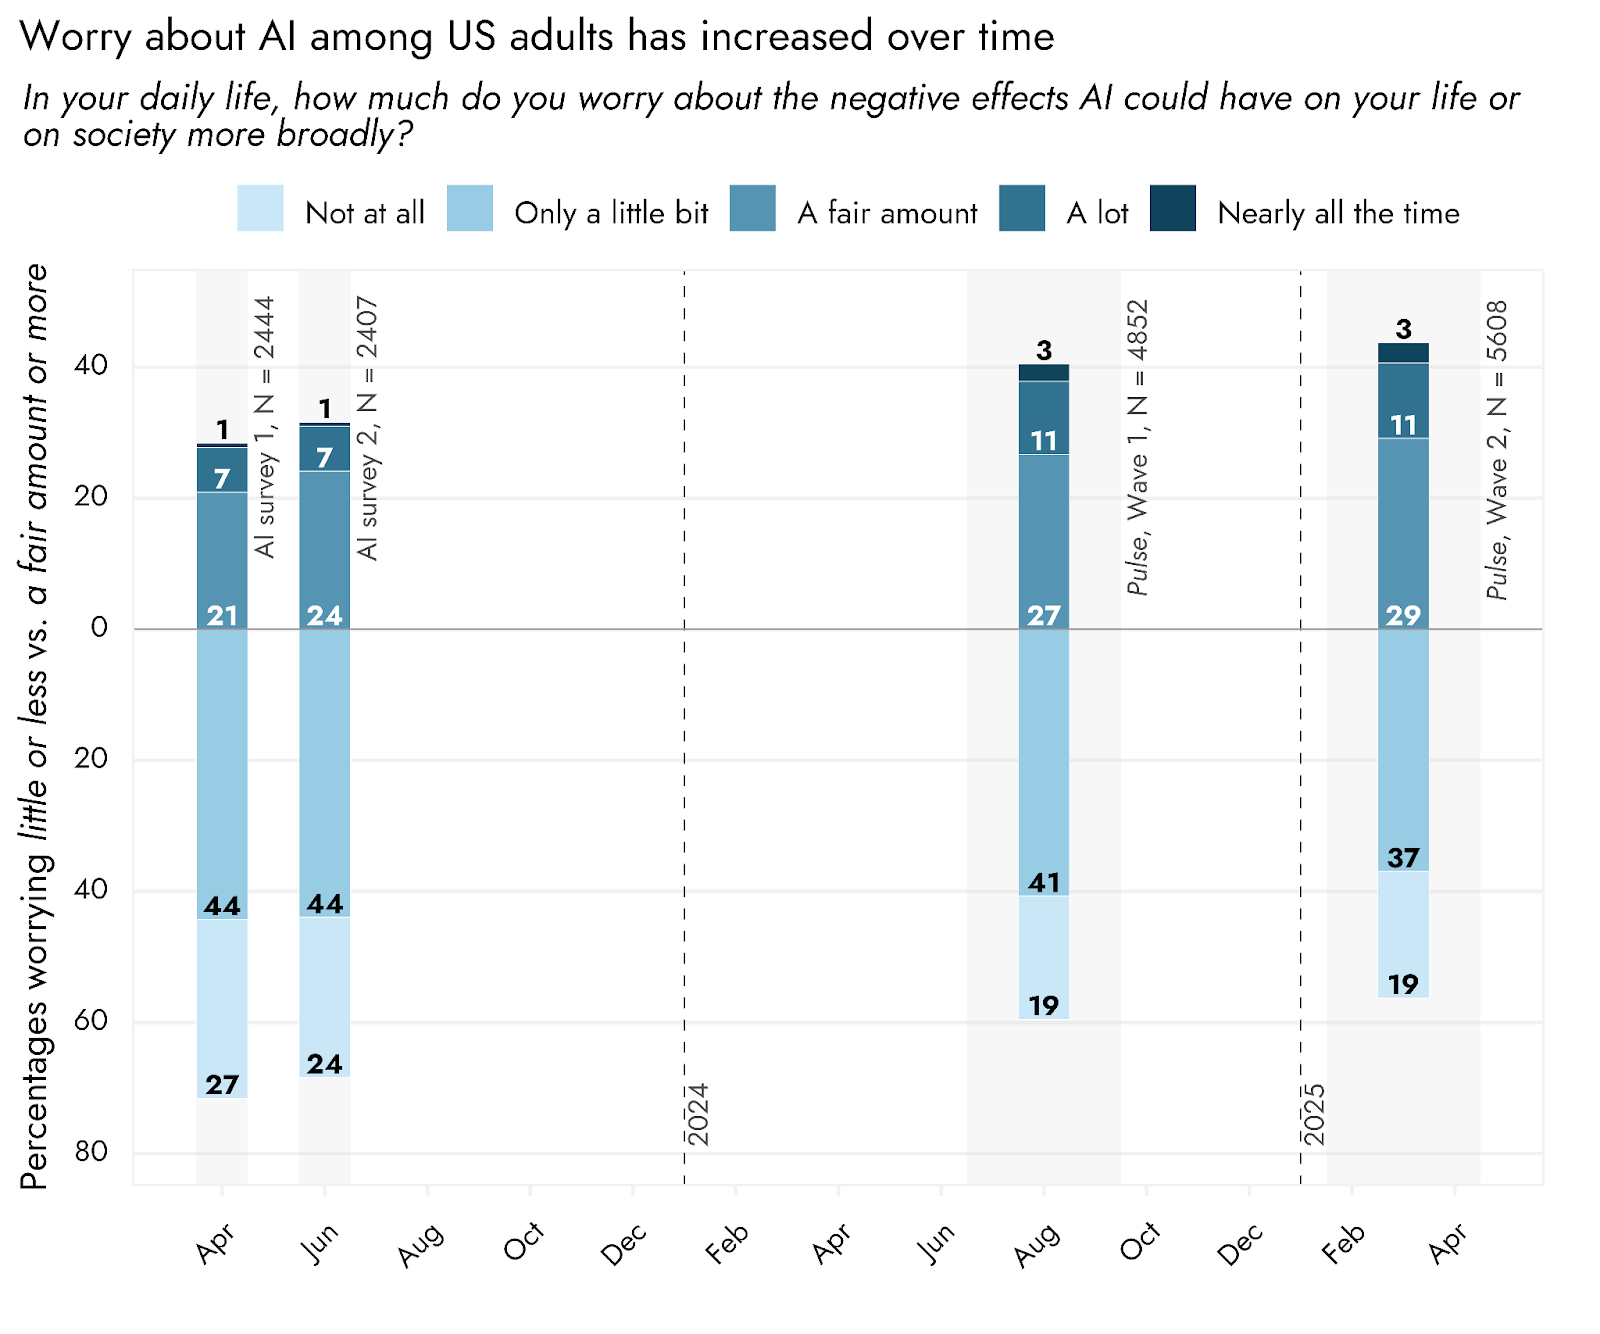
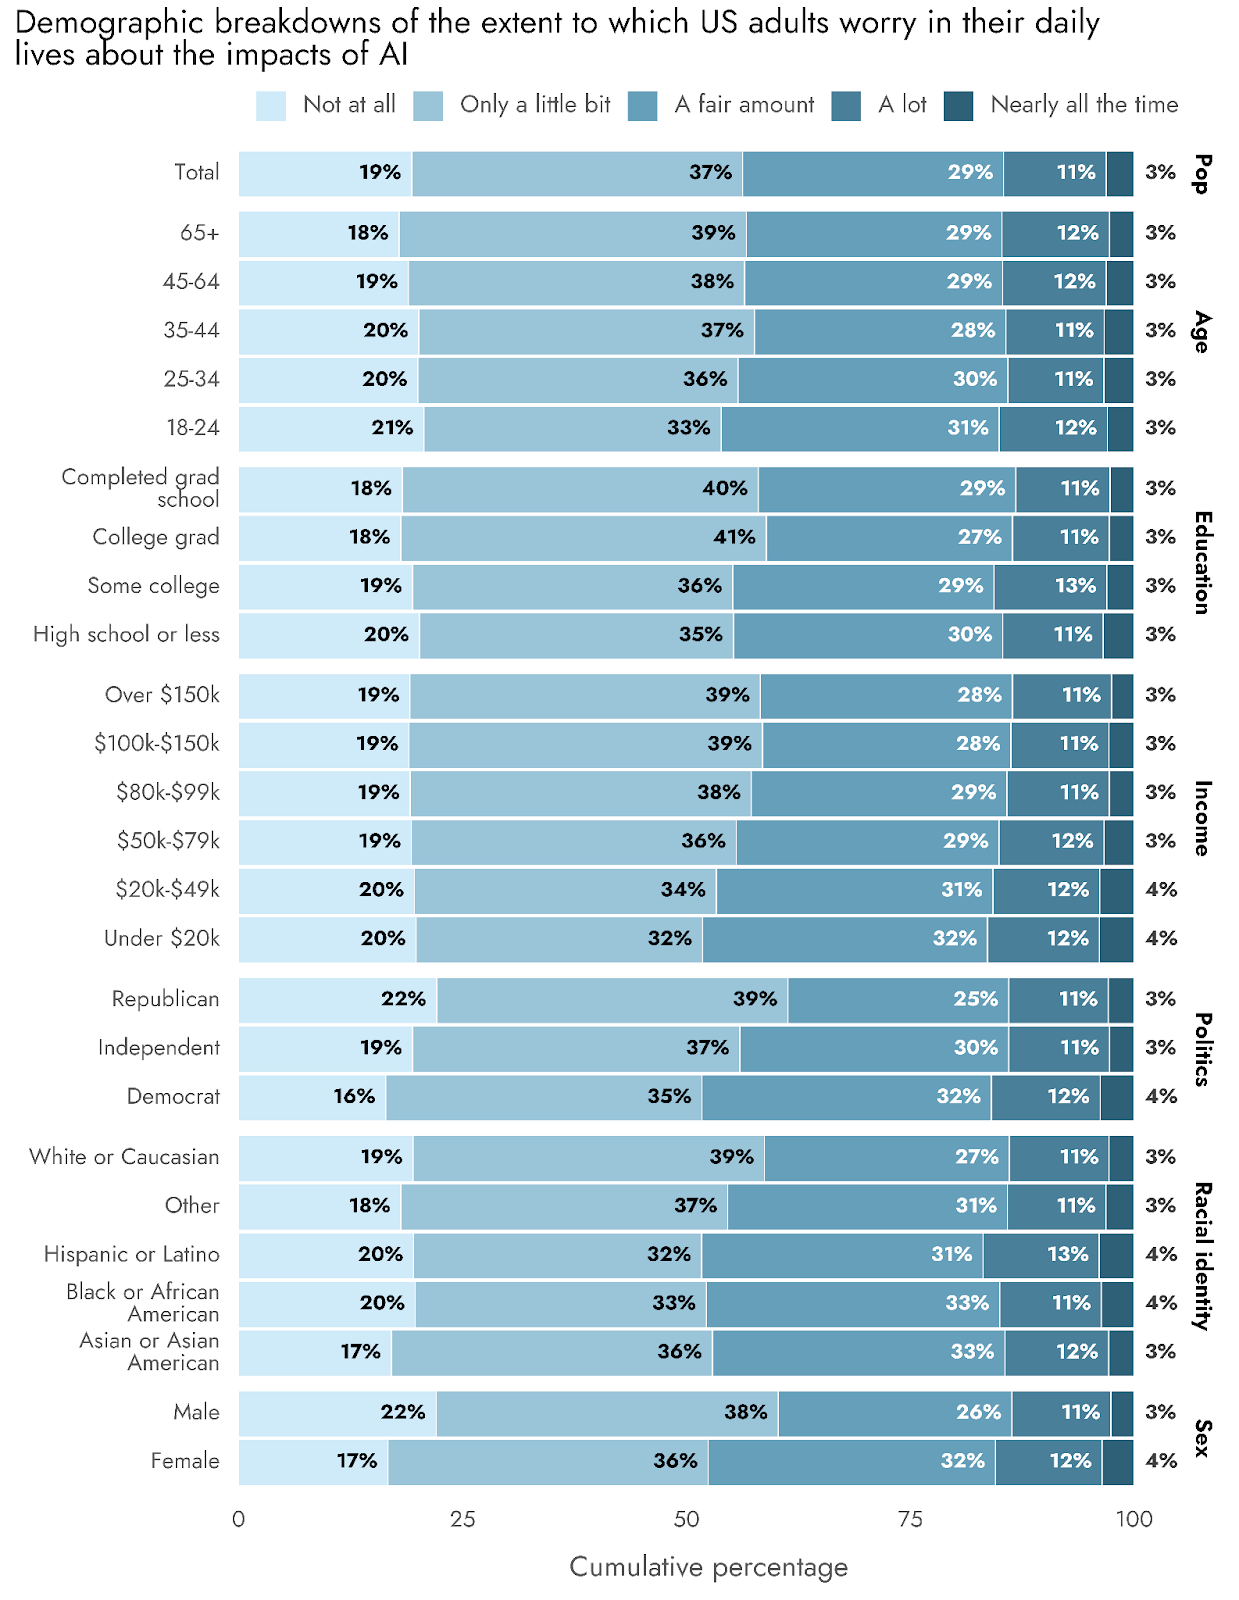
(03:40 ) Worry about AI

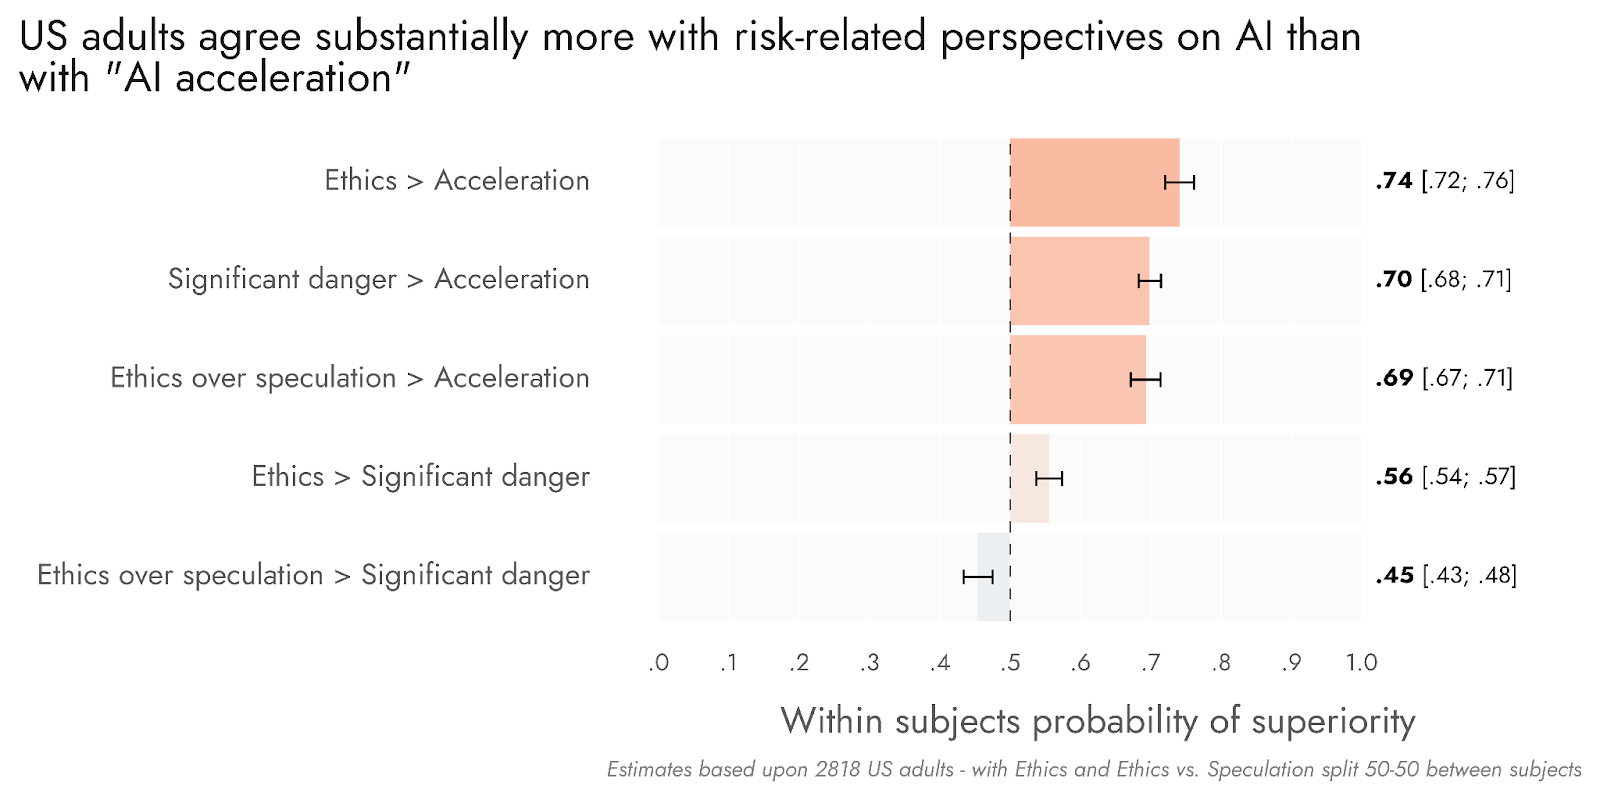
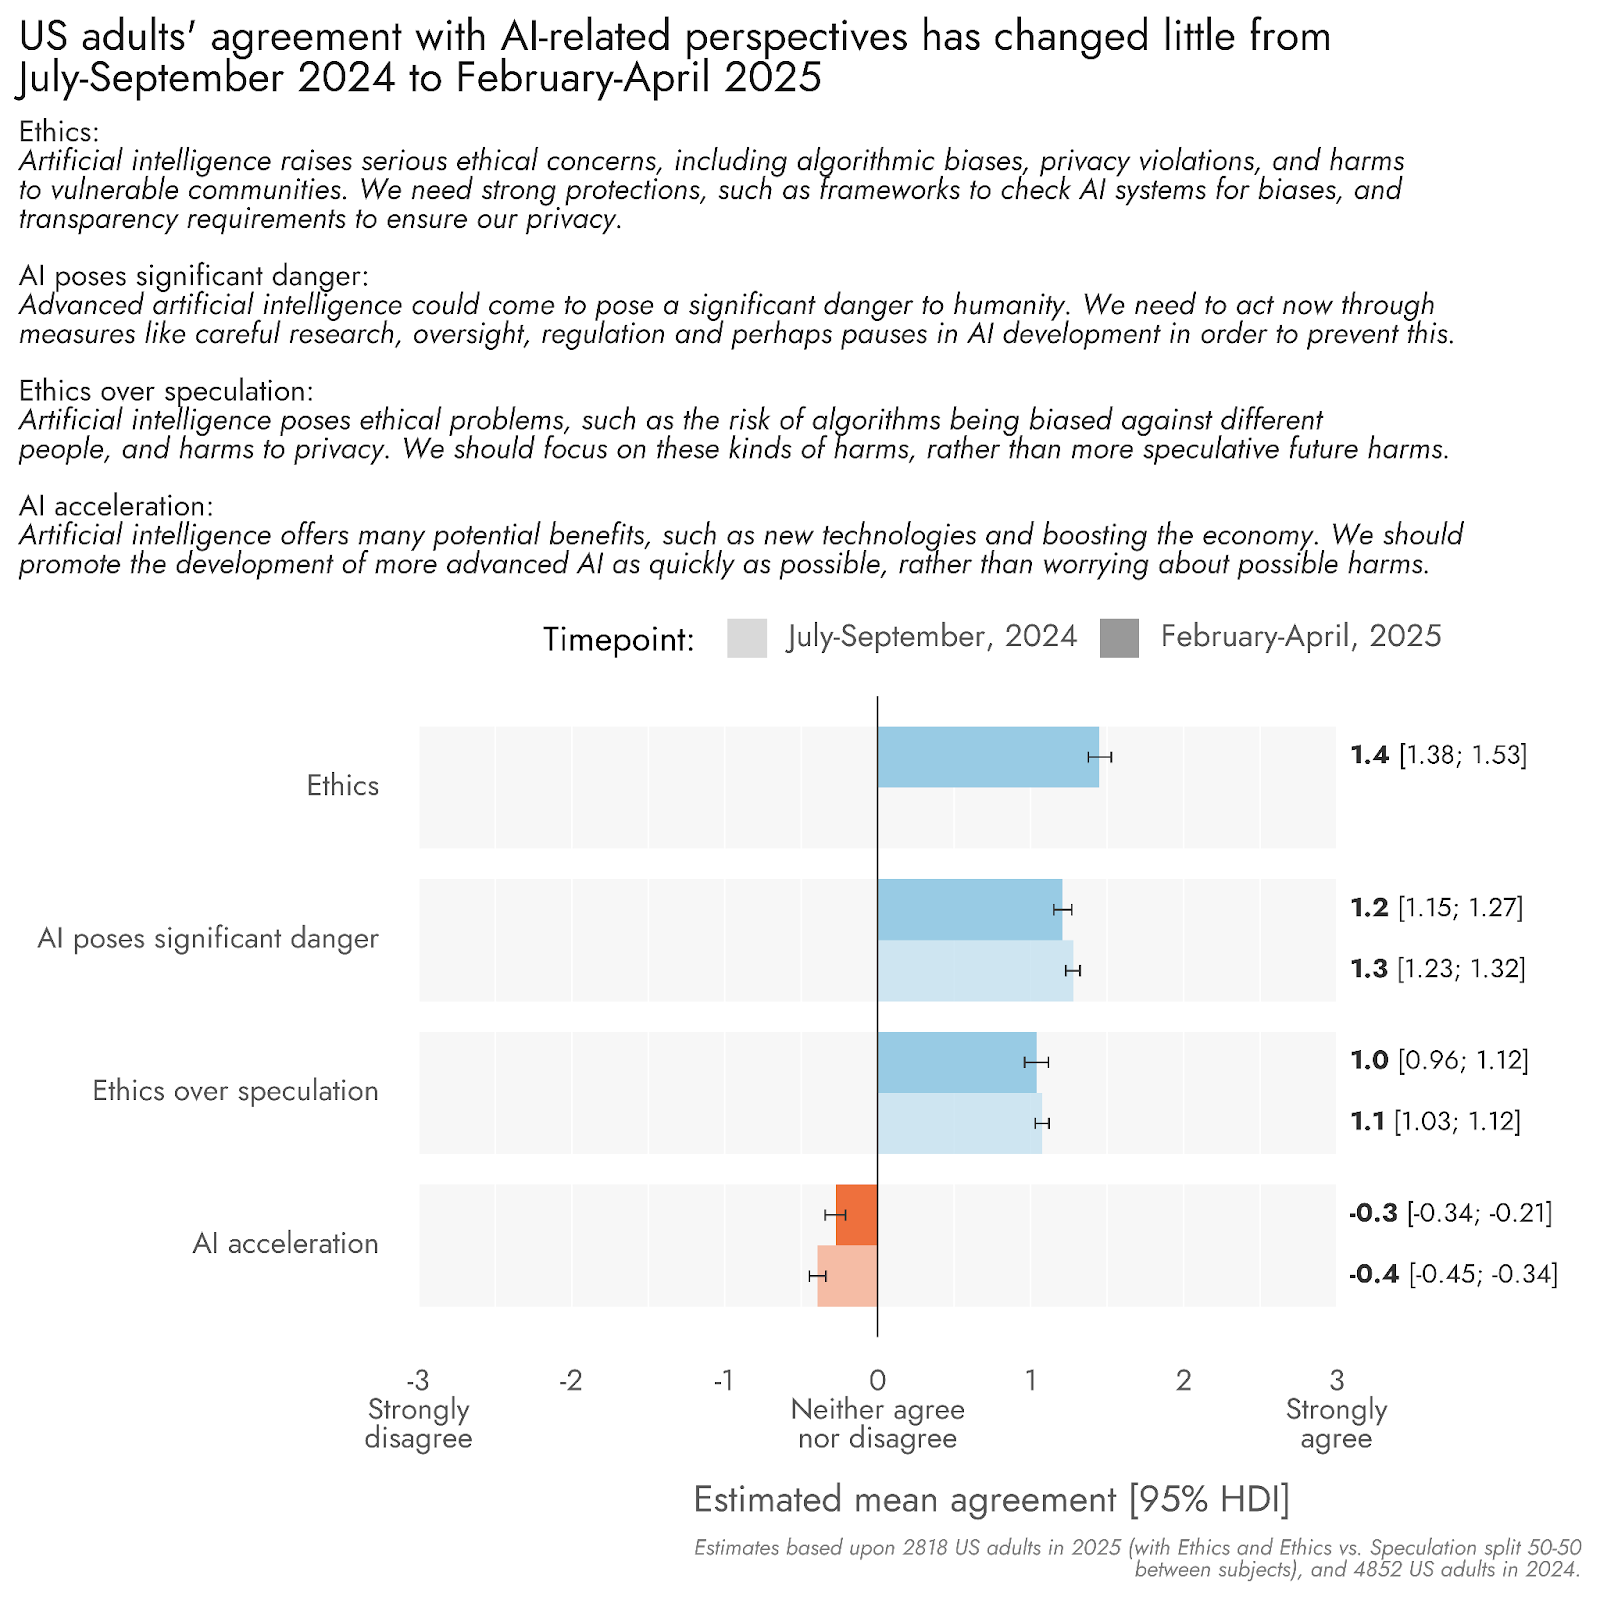
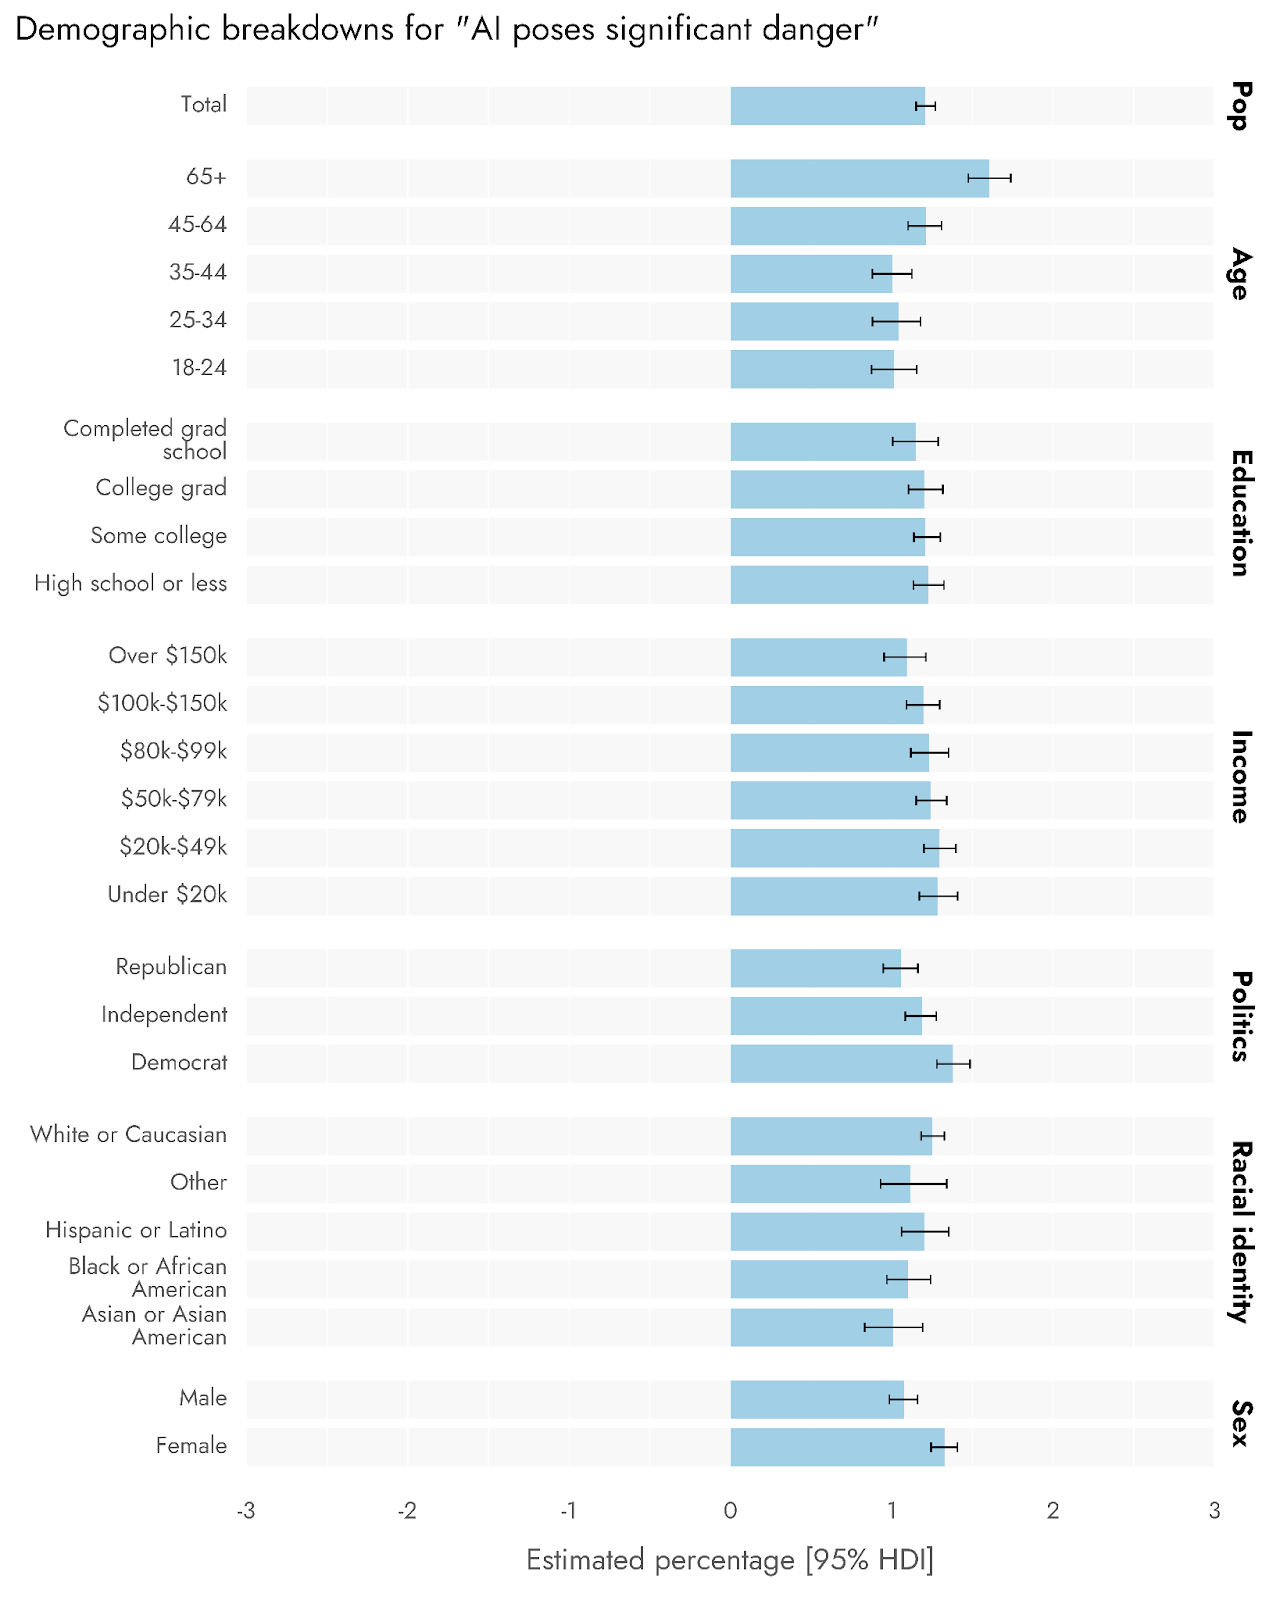
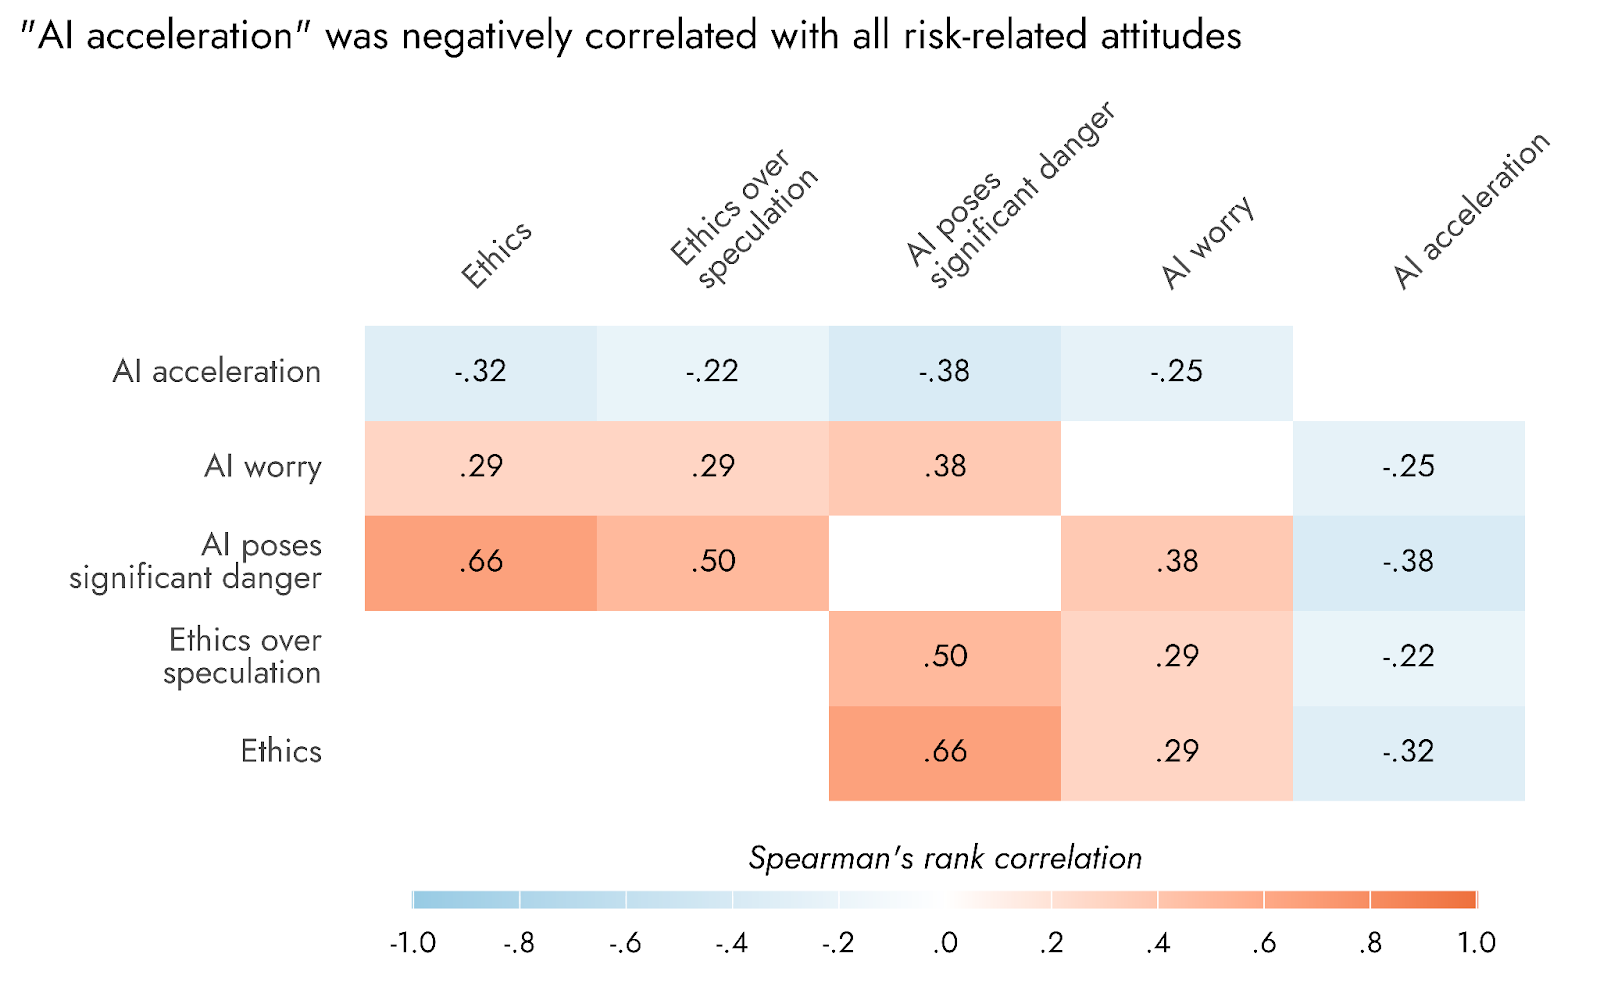
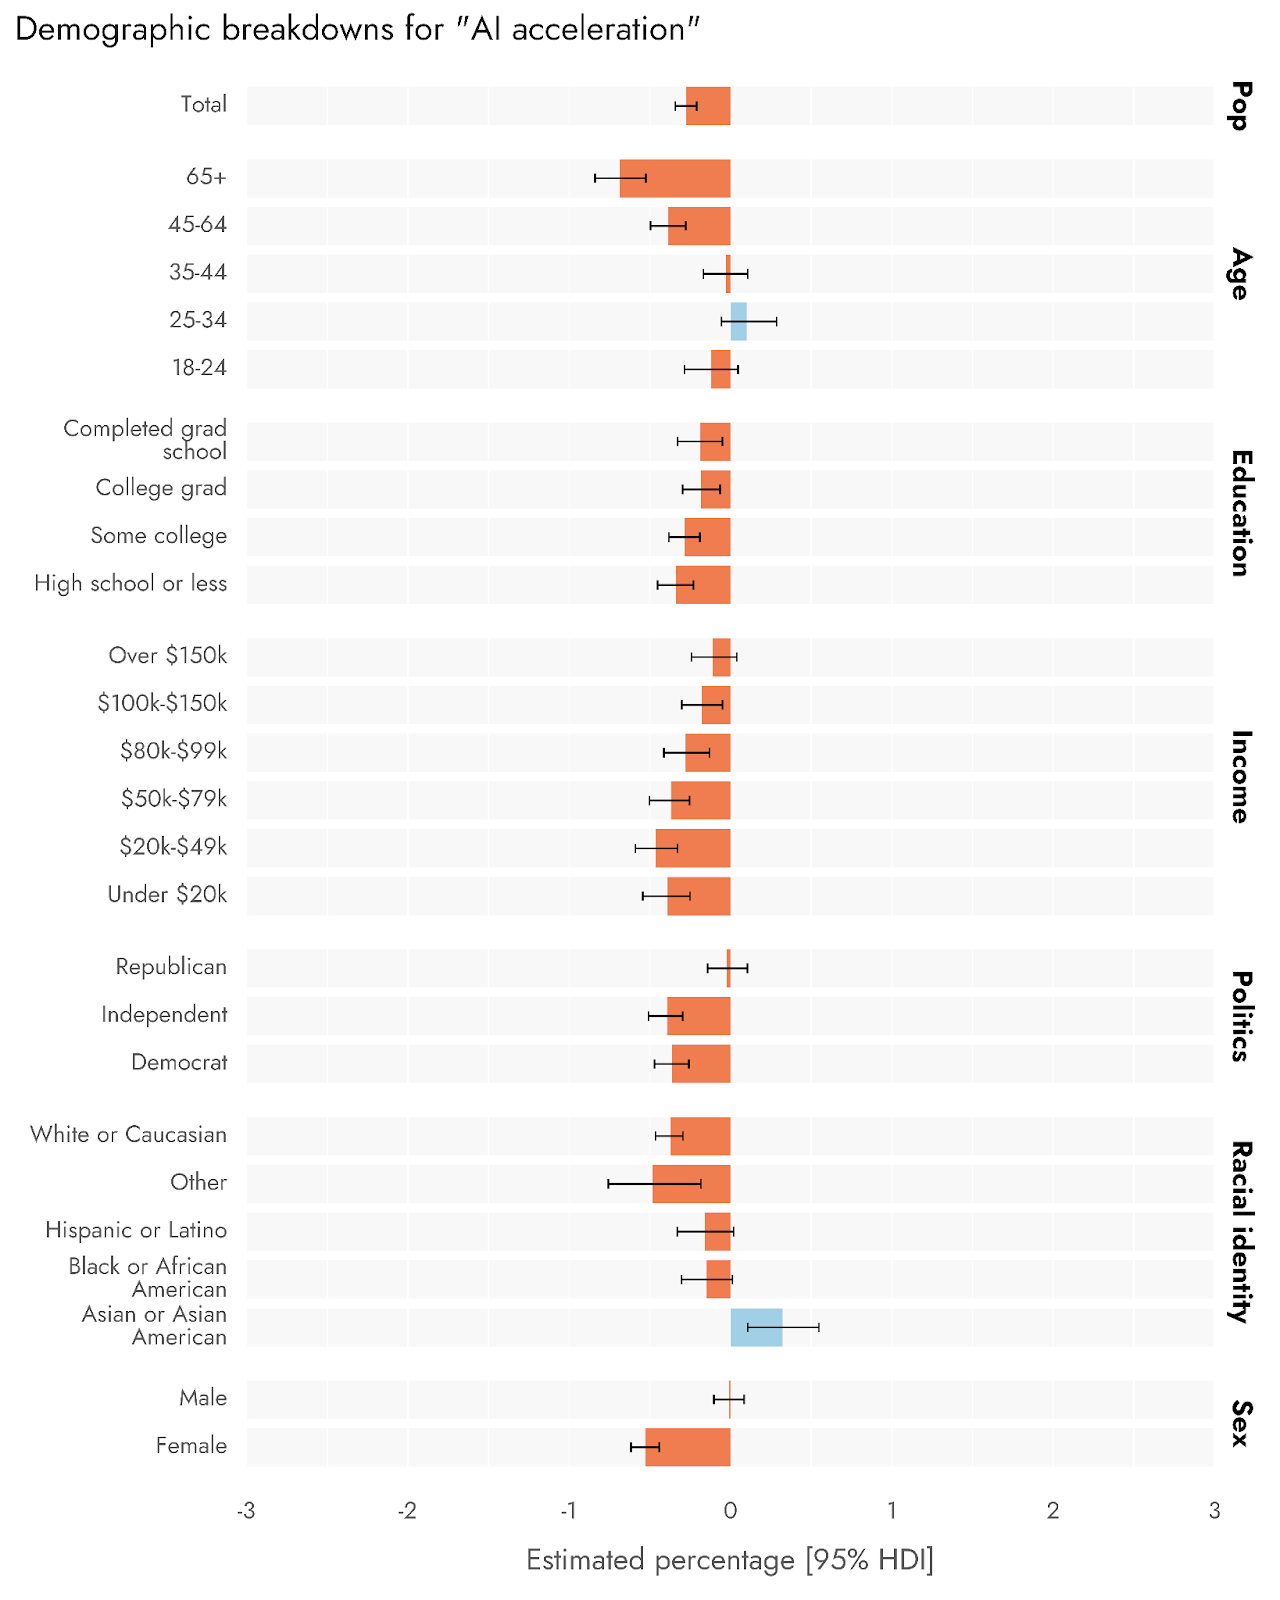
(07:50 ) How the US public views different stances on AI

---


First published:

September 12th, 2025


Source:

https://forum.effectivealtruism.org/posts/xAoAB2bopZP2FWomt/us-public-attitudes-towards-artificial-intelligence-wave-2


---


Narrated by TYPE III AUDIO.


---

Images from the article:

Graph showing worry about AI from 2023-2025, with probability distribution curves.
Horizontal bar graph showing US adults' perspectives on AI ethics versus acceleration.
Statistical graph showing AI attitudes comparison between 2024-2025, measuring Cohen's d and Probability of Superiority.
Demographic breakdown chart titled
Rethink Priorities logo featuring blue geometric letter A design
Demographic breakdown chart showing
Graph showing US adults' agreement with AI perspectives from 2024-2025, comparing four viewpoints: ethics, danger, speculation, and acceleration.
Survey graph showing public concern about AI's negative effects from 2023-2025. The graph displays response percentages across five worry levels, from
Bar graph titled
Demographic chart showing how different US population groups worry about AI impacts.  This visualization breaks down AI-related concerns across age, education, income, political affiliation, race, and gender groups, showing varying levels of worry from
Demographic survey data showing views on AI danger across different population groups  This graph breaks down responses about AI risk perception across multiple demographic categories including age, education, income, politics, race, and sex, with confidence intervals shown.
Correlation matrix showing relationships between AI acceleration and various risk attitudes.  The visualization shows Spearman's rank correlations between different AI-related concerns, with AI acceleration having negative correlations (shown in blue) with all other measured attitudes like ethics, worry, and perceived danger.
Demographic breakdown graph showing various population segments' views on

Apple Podcasts and Spotify do not show images in the episode description. Try Pocket Casts, or another podcast app.

Comments 
loading
In Channel
loading
00:00
00:00
x

0.5x

0.8x

1.0x

1.25x

1.5x

2.0x

3.0x

Sleep Timer

Off

End of Episode

5 Minutes

10 Minutes

15 Minutes

30 Minutes

45 Minutes

60 Minutes

120 Minutes

“US public attitudes towards artificial intelligence (Wave 2 of Pulse)” by Jamie E, David_Moss

“US public attitudes towards artificial intelligence (Wave 2 of Pulse)” by Jamie E, David_Moss