Cosmo: The Graph Visualization Tool Built for Your Terminal
Description
This story was originally published on HackerNoon at: https://hackernoon.com/cosmo-the-graph-visualization-tool-built-for-your-terminal.
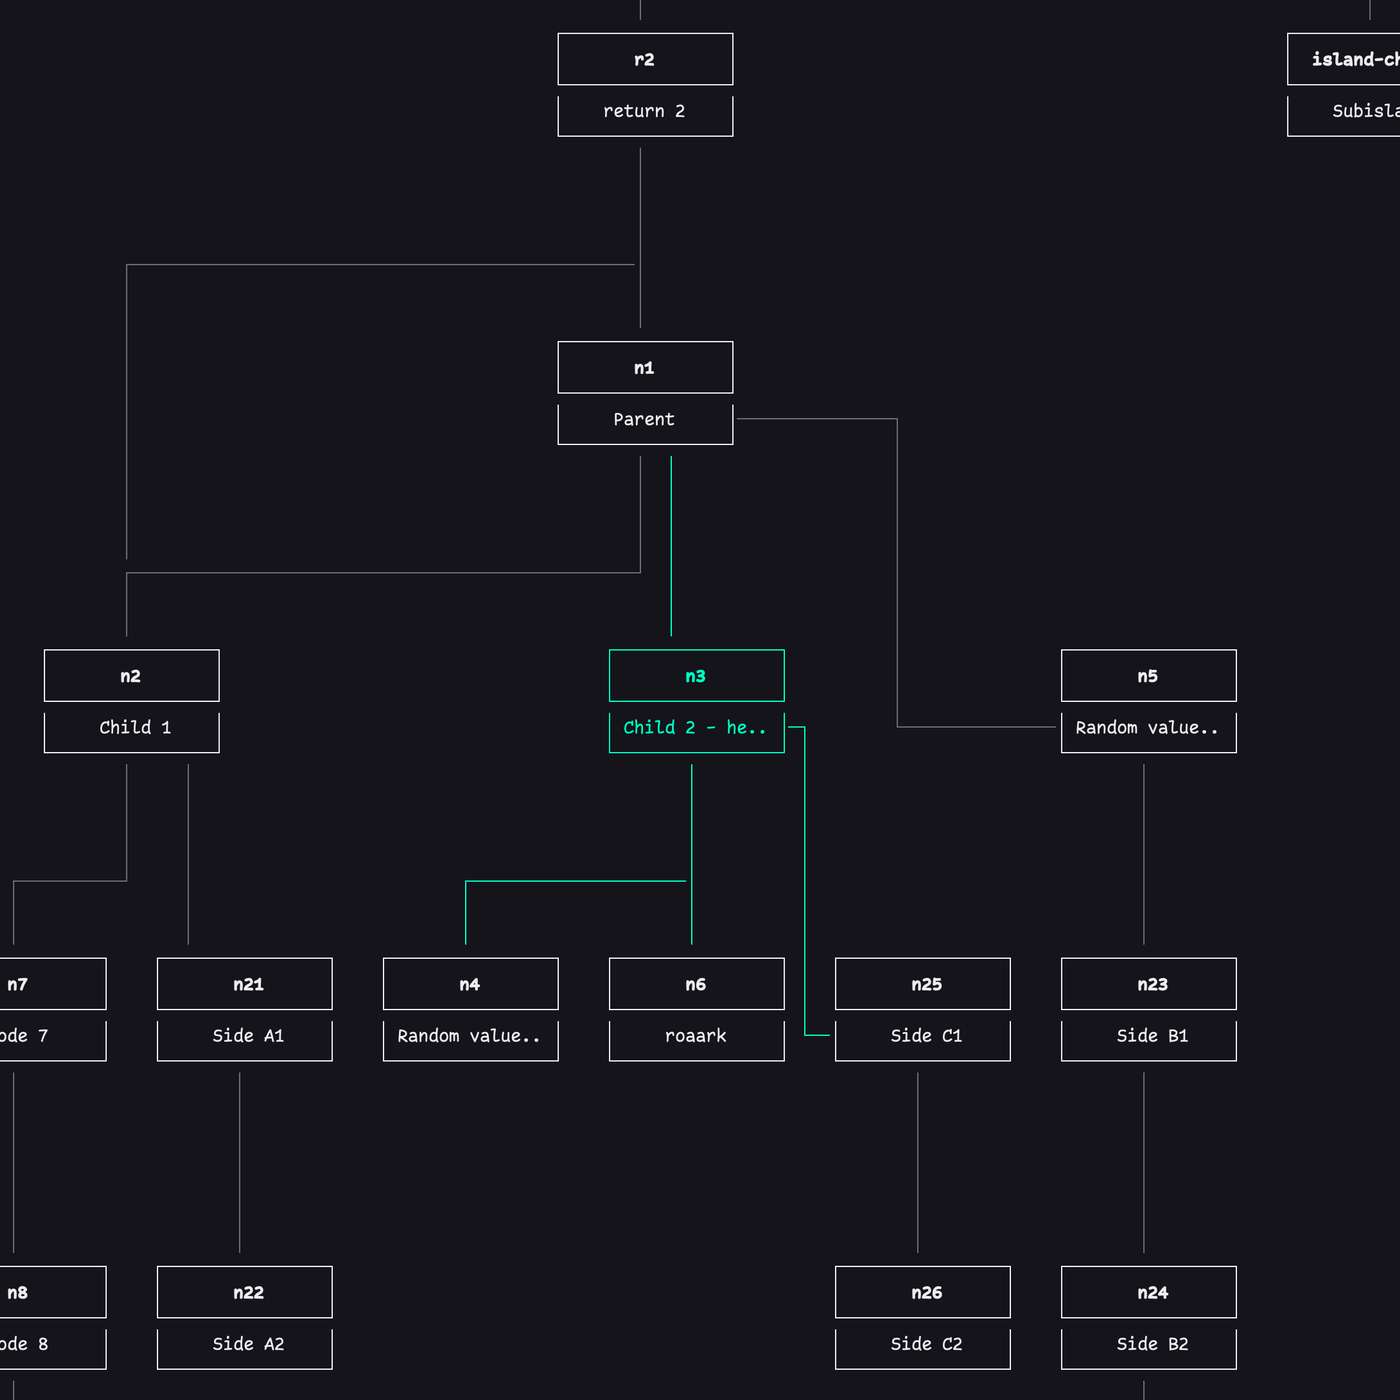
Cosmo is a terminal-based interactive graph visualizer that automatically layouts and displays complex data structures for quick exploration.
Check more stories related to data-science at: https://hackernoon.com/c/data-science.
You can also check exclusive content about #visualization, #terminal, #cli, #graphs, #tui, #cosmo, #complex-data-structures, #gui-visualizer, and more.
This story was written by: @hacker227143. Learn more about this writer by checking @hacker227143's about page,
and for more stories, please visit hackernoon.com.
Cosmo is a fast, interactive graph visualizer that makes graphs and trees easy to understand, beautifully arranged, and fully explorable without ever leaving your command line. Pass your data structures directly from code or file and see them come to life.

