


Mapped: Where Americans Need Housing Assistance, by State
Description
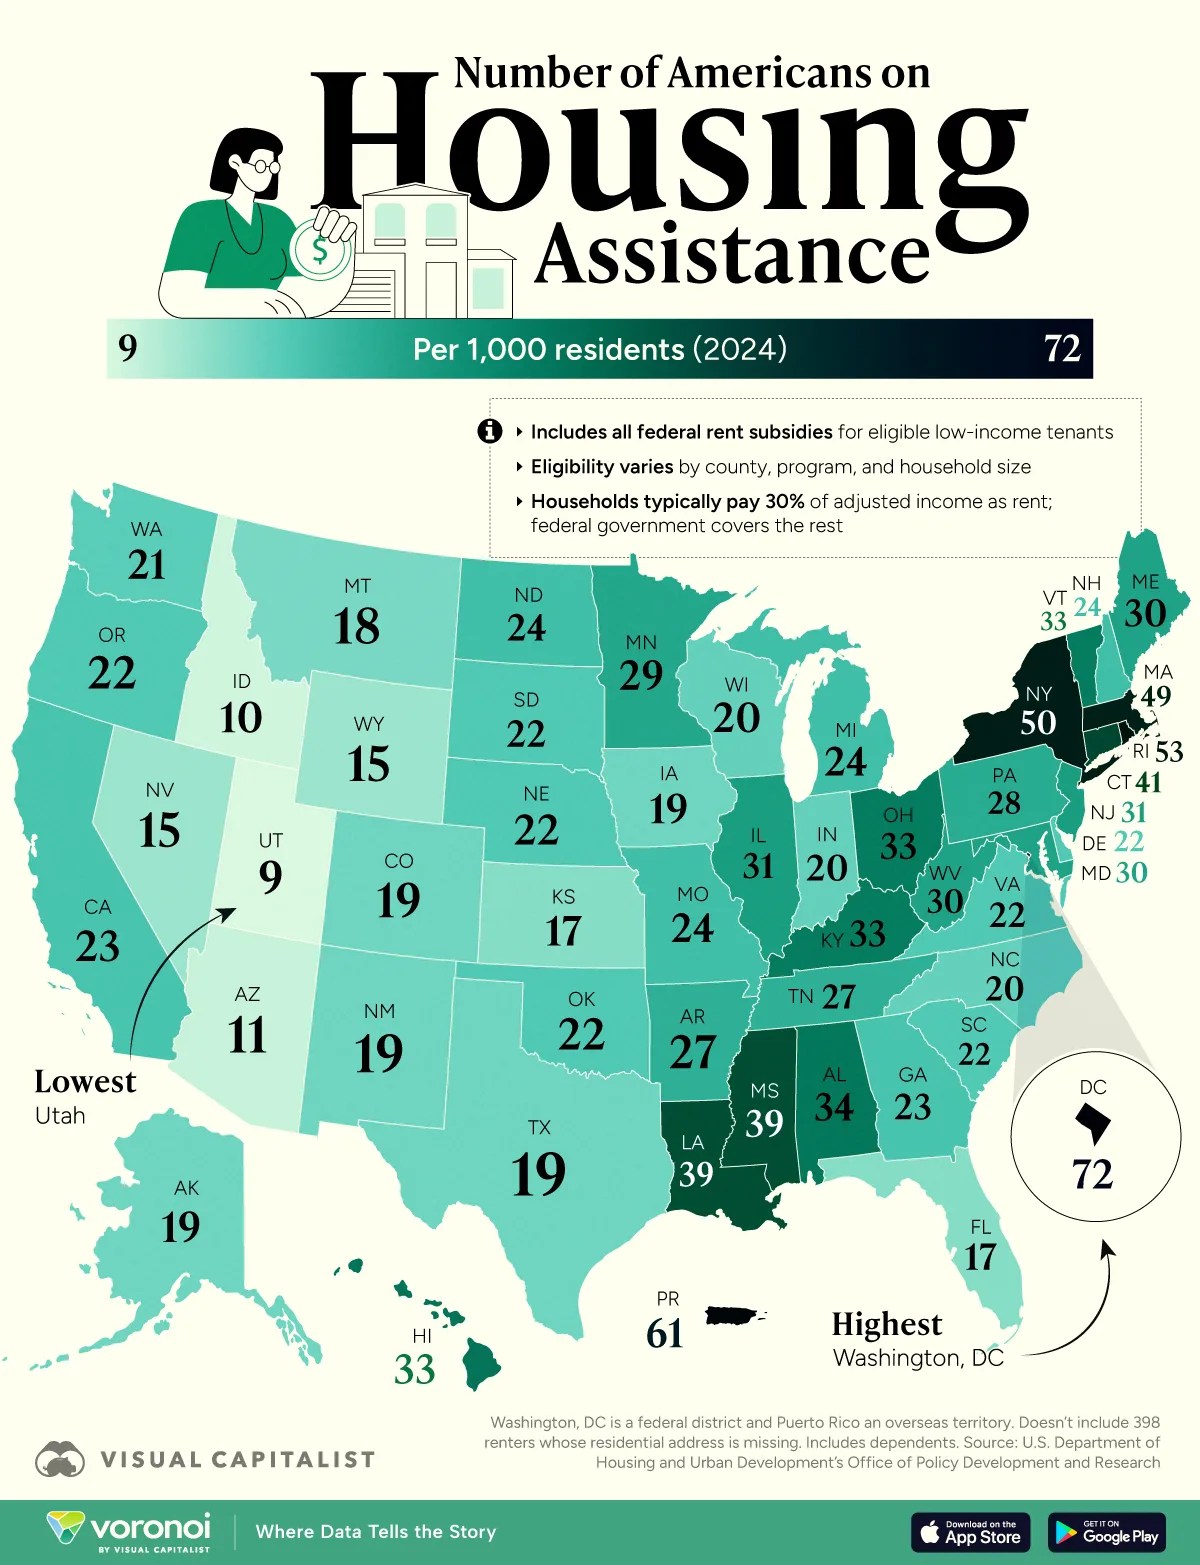
Where Americans Need Housing Assistance, Ranked by State
See visuals like this from many other data creators on our Voronoi app. Download it for free on iOS or Android and discover incredible data-driven charts from a variety of trusted sources.
Key Takeaways
- D.C. has the highest share of low-income renters on housing assistance: 72 per 1,000 residents. It’s followed by Puerto Rico (61) and Rhode Island (53).
- In absolute numbers, the country’s four largest states—New York (1 million), California (919K), Texas (595K), and Florida (405K)—support the most renters.
- All data as of 2024.
Housing costs keep climbing faster than wages in many parts of the U.S., putting extra pressure on low-income renters.
The visualization maps all 50 states, the District of Columbia, and Puerto Rico by how many low-income renters receive federal housing assistance relative to their population.
Data is sourced from the U.S. Department of Housing and Urban Development’s Office of Policy Development and Research (HUD).
HUD’s 2024 estimates count more than 9 million Americans (27 per 1,000) currently receiving vouchers, public-housing units, or other subsidies.
Households typically pay 30% of their adjusted income (i.e. after taxes) as rent, and the government covers the rest.
Ranked: Americans Needing Rental Assistance, by State
D.C. stands out with 72 assisted renters per 1,000 residents.
That’s more than double the U.S. average of 27 and reflects both DC’s high housing costs, its population growth since 2000, and the limited growth in housing in the same time period.
| Rank | State | Code | # of People on Housing Assistance (2024) | State Population | # of People on Housing Assistance per 1,000 Residents |
|---|---|---|---|---|---|
| 1 | District of Columbia | DC | 50,389 | 702,250 | 72 |
| 2 | Puerto Rico | PR | 196,165 | 3,203,295 | 61 |
| 3 | Rhode Island | RI | 58,640 | 1,112,308 | 53 |
| 4 | New York | NY | 1,000,730 | 19,867,248 | 50 |
| 5 | Massachusetts | MA | 346,968 | 7,136,171 | 49 |
| 6 | Connecticut | CT | 148,989 | 3,675,069 | 41 |
| 7 | Mississippi | MS | 115,391 | 2,943,045 | 39 |
| 8 | Louisiana | LA | 178,836 | 4,597,740 | 39 |
| 9 | Alabama | AL | 175,759 | 5,157,699 | 34 |
| 10 | Ohio | OH | 392,408 | 11,883,304 | 33 |
| 11 | Vermont | VT | 21,313 | 648,493 | 33 |
| 12 | Kentucky | KY | 150,525 | 4,588,372 | 33 |
| 13 | Hawaii | HI | 47,342 | 1,446,146 | 33 |
| 14 | Illinois | IL | 392,302 | 12,710,158 | 31 |
| 15 | New Jersey | NJ | 289,801 | 9,500,851 | 31 |
| 16 | Maryland | MD | 187,764 | 6,263,220 | 30 |
| 17 | West Virginia | WV | 52,826 | 1,769,979 | 30 |
| 18 | Maine | ME | 41,698 | 1,405,012 | 30 |
| 19 | Minnesota | MN | 165,434 | 5,793,151 | 29 |
| 20 | Pennsylvania | PA | 366,433 | 13,078,751 | 28 |
| 21 | Arkansas | AR | 82,678 | 3,088,354 | 27 |
| 22 | Tennessee | TN | 193,490 | 7,227,750 | 27 |
| 23 | North Dakota | ND | 19,271 | 796,568 | 24 |
| 24 | New Hampshire | NH | 33,811 | 1,409,032 | 24 |
| 25 | Michigan | MI | 242,304 | 10,140,459 | 24 |
| 26 | Missouri | MO | 147,635 | 6,245,466 | 24 |
| 27 | California | CA | 918,612 | 39,431,263 | 23 |
| 28 | Georgia | GA | 259,256 |


