Using Charts to Gain Perspective
Description
This segment first appeared in the 12/30/22 episode of the Atlanta Real Estate Report…
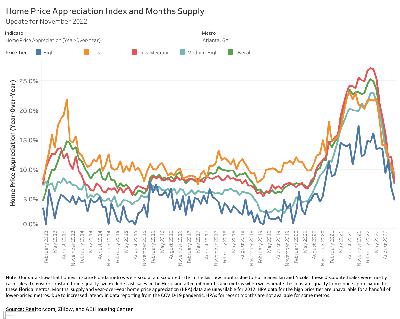
Let’s look at a few charts to gain some perspective…
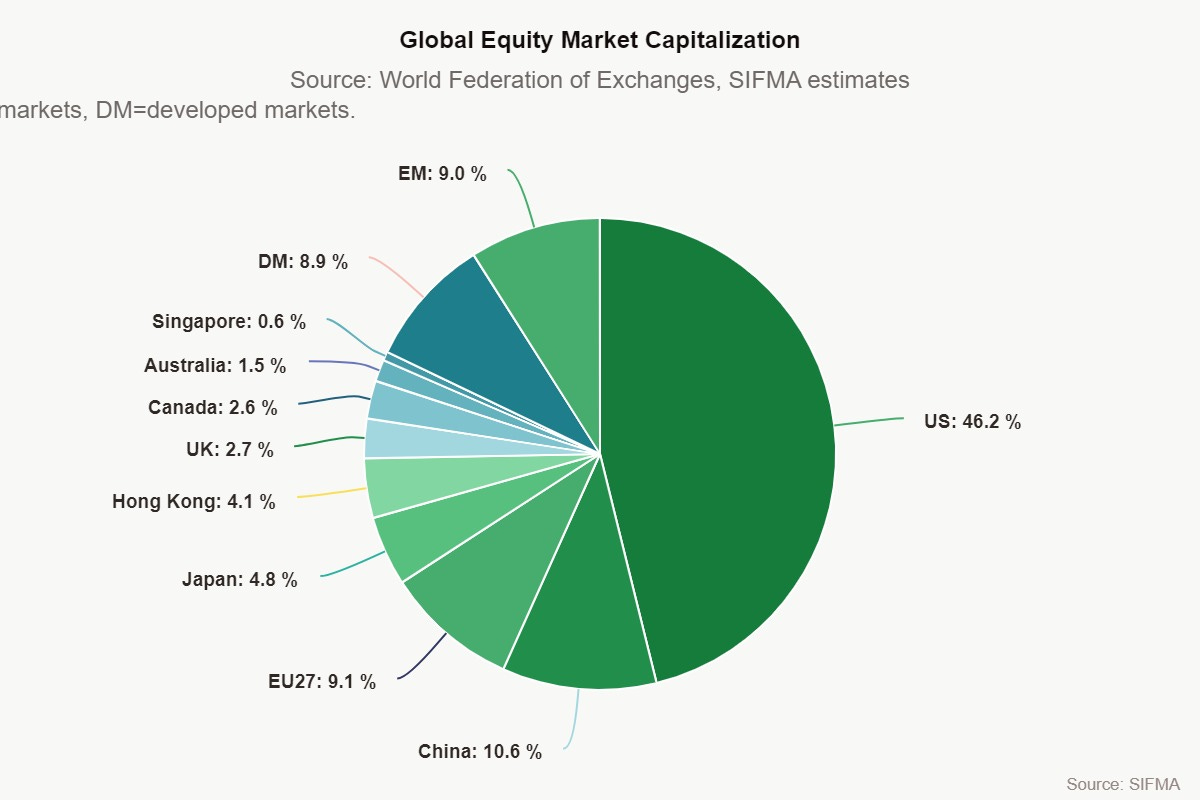
The sheer size of the equity markets makes them a powerful force when it comes to their economic impact on Main Street…
> > > Click on the images below to enlarge the charts…
In the chart above, note the move from the GFC low in 2009 to the pandemic high of late 2021. Equity market cap rose from about 50% to almost 200% of GDP. That is one heck of a run!
Stock prices and the business cycle…
Stock prices and building permits are leading indicators…
Atlanta Real Estate Report by ATLsherpa is a reader-supported publication. To receive new posts and support my work, consider becoming a free or paid subscriber.
This is a public episode. If you would like to discuss this with other subscribers or get access to bonus episodes, visit atlantarealestate.substack.com

