DiscoverThe Lead-Lag ReportJapan’s New Prime Minister Wants to Control the Central Bank — What Could Go Wrong
Japan’s New Prime Minister Wants to Control the Central Bank — What Could Go Wrong

Japan’s New Prime Minister Wants to Control the Central Bank — What Could Go Wrong

Update: 2025-10-10
Share

Description

The past week underscored an extraordinary divergence between darkening economic data and buoyant financial markets. A U.S. shutdown, which started on Oct. 1, put the data in a no-man’s land – not even the make-or-break September non-farm payrolls report was available¹. But a private-sector employment survey closed some gaps; ADP said that September saw 31,000 jobs lost versus expectations of a gain north of 50k, all but confirming the labor market’s momentum has cooled¹. These labor market concerns caused consumer confidence to fall to its lowest level in five months¹.

<figure>
<source type="image/webp" />
<svg class="lucide lucide-refresh-cw" fill="none" height="20" stroke="currentColor" stroke-linecap="round" stroke-linejoin="round" stroke-width="2" viewBox="0 0 24 24" width="20" xmlns="http://www.w3.org/2000/svg"><path d="M3 12a9 9 0 0 1 9-9 9.75 9.75 0 0 1 6.74 2.74L21 8"></path><path d="M21 3v5h-5"></path><path d="M21 12a9 9 0 0 1-9 9 9.75 9.75 0 0 1-6.74-2.74L3 16"></path><path d="M8 16H3v5"></path></svg>
<svg class="lucide lucide-maximize2 lucide-maximize-2" fill="none" height="20" stroke="currentColor" stroke-linecap="round" stroke-linejoin="round" stroke-width="2" viewBox="0 0 24 24" width="20" xmlns="http://www.w3.org/2000/svg"><polyline points="15 3 21 3 21 9"></polyline><polyline points="9 21 3 21 3 15"></polyline><line x1="21" x2="14" y1="3" y2="10"></line><line x1="3" x2="10" y1="21" y2="14"></line></svg>
</figure>

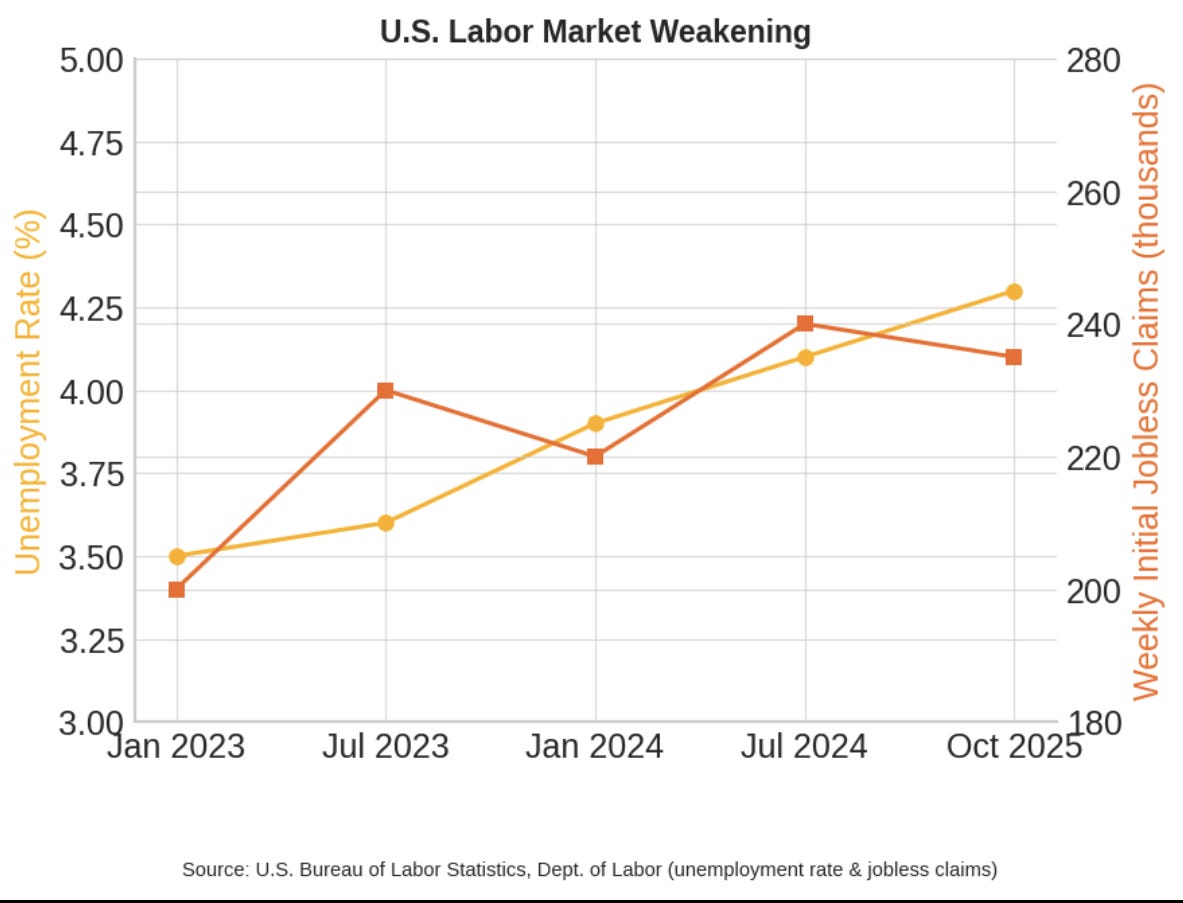
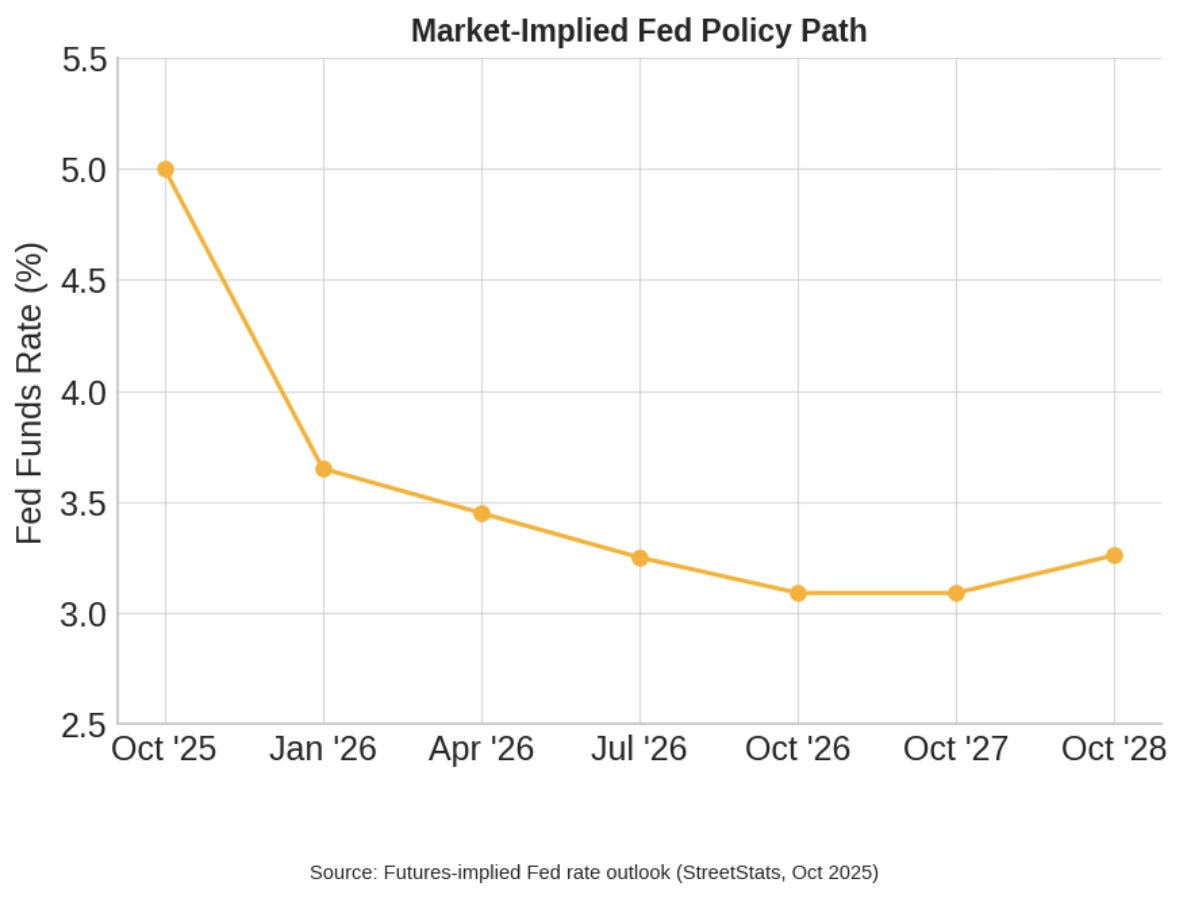
With unmistakable signals of a cooling job market, the Federal Reserve is getting ready to pivot toward easing. Powerful officials like John Williams on the New York Fed and Mary Daly, of San Francisco, indicated comfort with additional cuts in interest rates to offset labor softness². After all, the Fed already slashed rates by 0.25% last month (in a hotly contested 11–1 vote) and futures markets now give us a whopping 95% odds of yet another quarter-point cut at the next October meeting. Unemployment has risen to 4.3% and Fed policymakers envisage at least two further cuts by year-end in order to provide insurance against a hard landing². Still, not everyone at the Fed is completely on board — Governor Michael Barr and some others are counseling caution, concerned that loosening policy too soon might spark a fresh outbreak of inflation². It’s a fine balance, but for now the doves have the upper hand as job market steam has fizzled quickly.

<figure>
<source type="image/webp" />
<svg class="lucide lucide-refresh-cw" fill="none" height="20" stroke="currentColor" stroke-linecap="round" stroke-linejoin="round" stroke-width="2" viewBox="0 0 24 24" width="20" xmlns="http://www.w3.org/2000/svg"><path d="M3 12a9 9 0 0 1 9-9 9.75 9.75 0 0 1 6.74 2.74L21 8"></path><path d="M21 3v5h-5"></path><path d="M21 12a9 9 0 0 1-9 9 9.75 9.75 0 0 1-6.74-2.74L3 16"></path><path d="M8 16H3v5"></path></svg>
<svg class="lucide lucide-maximize2 lucide-maximize-2" fill="none" height="20" stroke="currentColor" stroke-linecap="round" stroke-linejoin="round" stroke-width="2" viewBox="0 0 24 24" width="20" xmlns="http://www.w3.org/2000/svg"><polyline points="15 3 21 3 21 9"></polyline><polyline points="9 21 3 21 3 15"></polyline><line x1="21" x2="14" y1="3" y2="10"></line><line x1="3" x2="10" y1="21" y2="14"></line></svg>
</figure>

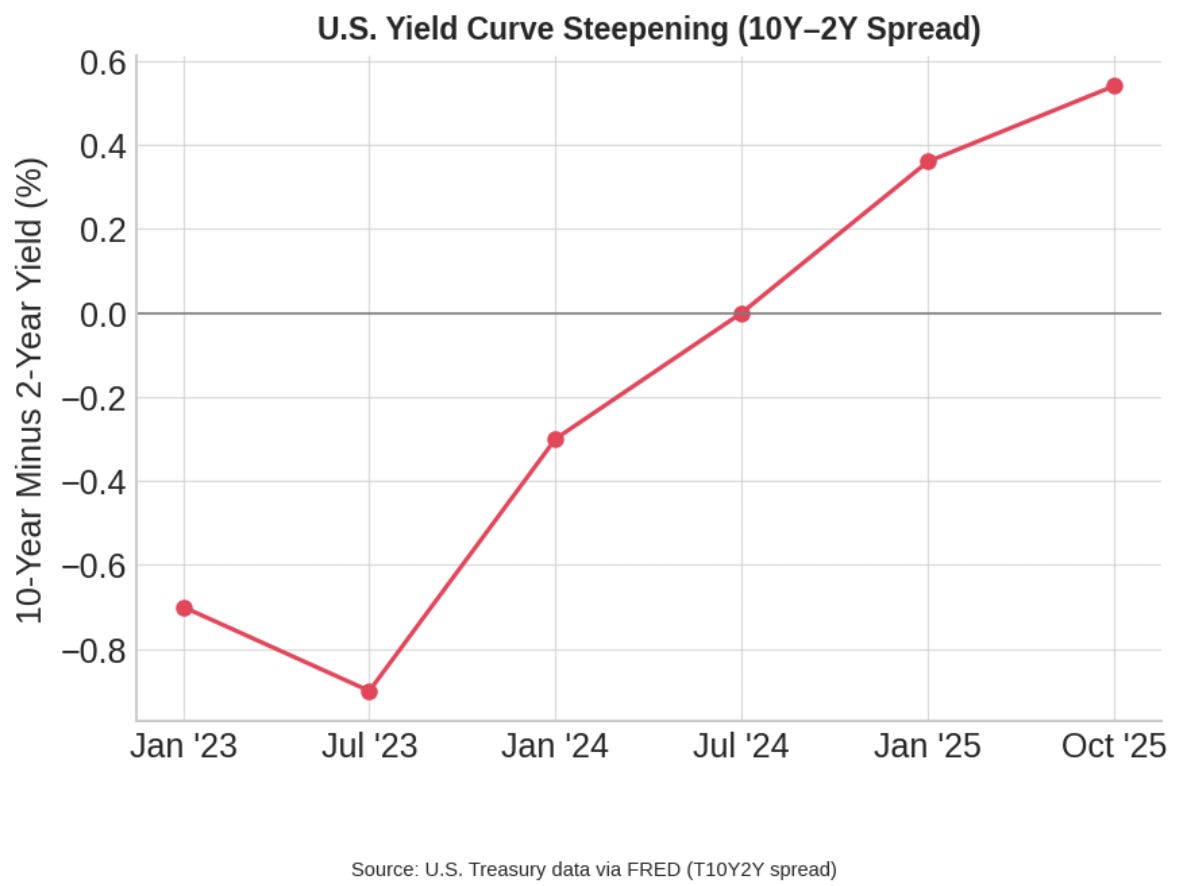
Short-term Treasury rates have dropped as investors price in the Fed easing, but longer-dated yields have held up relatively well. The upshot has been the biggest steepening of the yield curve in years³ and a sign that traders expect rate cuts to stave off a more serious downturn. The U.S. dollar that had been underpinned by high rates has now started giving up its highs as this yield differential narrows.

<figure>
<source type="image/webp" />
<svg class="lucide lucide-refresh-cw" fill="none" height="20" stroke="currentColor" stroke-linecap="round" stroke-linejoin="round" stroke-width="2" viewBox="0 0 24 24" width="20" xmlns="http://www.w3.org/2000/svg"><path d="M3 12a9 9 0 0 1 9-9 9.75 9.75 0 0 1 6.74 2.74L21 8"></path><path d="M21 3v5h-5"></path><path d="M21 12a9 9 0 0 1-9 9 9.75 9.75 0 0 1-6.74-2.74L3 16"></path><path d="M8 16H3v5"></path></svg>
<svg class="lucide lucide-maximize2 lucide-maximize-2" fill="none" height="20" stroke="currentColor" stroke-linecap="round" stroke-linejoin="round" stroke-width="2" viewBox="0 0 24 24" width="20" xmlns="http://www.w3.org/2000/svg"><polyline points="15 3 21 3 21 9"></polyline><polyline points="9 21 3 21 3 15"></polyline><line x1="21" x2="14" y1="3" y2="10"></line><line x1="3" x2="10" y1="21" y2="14"></line></svg>
</figure>

Equity investors have paradoxically been savoring the deterioration of economic data under a “bad news is good news” framework. As Fed relief loomed, so did a rally in stocks: the S&P 500 was up about 1.1 percent for the week and global equities were up nearly 1.7 percent³ even despite the Washington gridlock. Major indices are not far from record highs, fueled by excitement about artificial intelligence and hopes that easier monetary policy will elongate the economic cycle. It is a story that I have seen play out before — where markets rally on the euphoria of soft data because it raises hopes for stimulus — and the euphoria can be brittle.

<figure>
<source type="image/webp" />
<svg class="lucide lucide-refresh-cw" fill="none" height="20" stroke="currentColor" stroke-linecap="round" stroke-linejoin="round" stroke-width="2" viewBox="0 0 24 24" width="20" xmlns="http://www.w3.org/2000/svg"><path d="M3 12a9 9 0 0 1 9-9 9.75 9.75 0 0 1 6.74 2.74L21 8"></path><path d="M21 3v5h-5"></path><path d="M21 12a9 9 0 0 1-9 9 9.75 9.75 0 0 1-6.74-2.74L3 16"></path><path d="M8 16H3v5"></path></svg>
<svg class="lucide lucide-maximize2 lucide-maximize-2" fill="none" height="20" stroke="currentColor" stroke-linecap="round" stroke-linejoin="round" stroke-width="2" viewBox="0 0 24 24" width="20" xmlns="http://www.w3.org/2000/svg"><polyline points="15 3 21 3 21 9"></polyline><polyline points="9 21 3 21 3 15"></polyline><line x1="21" x2="14" y1="3" y2="10"></line><line x1="3" x2="10" y1="21" y2="14"></line></svg>
</figure>

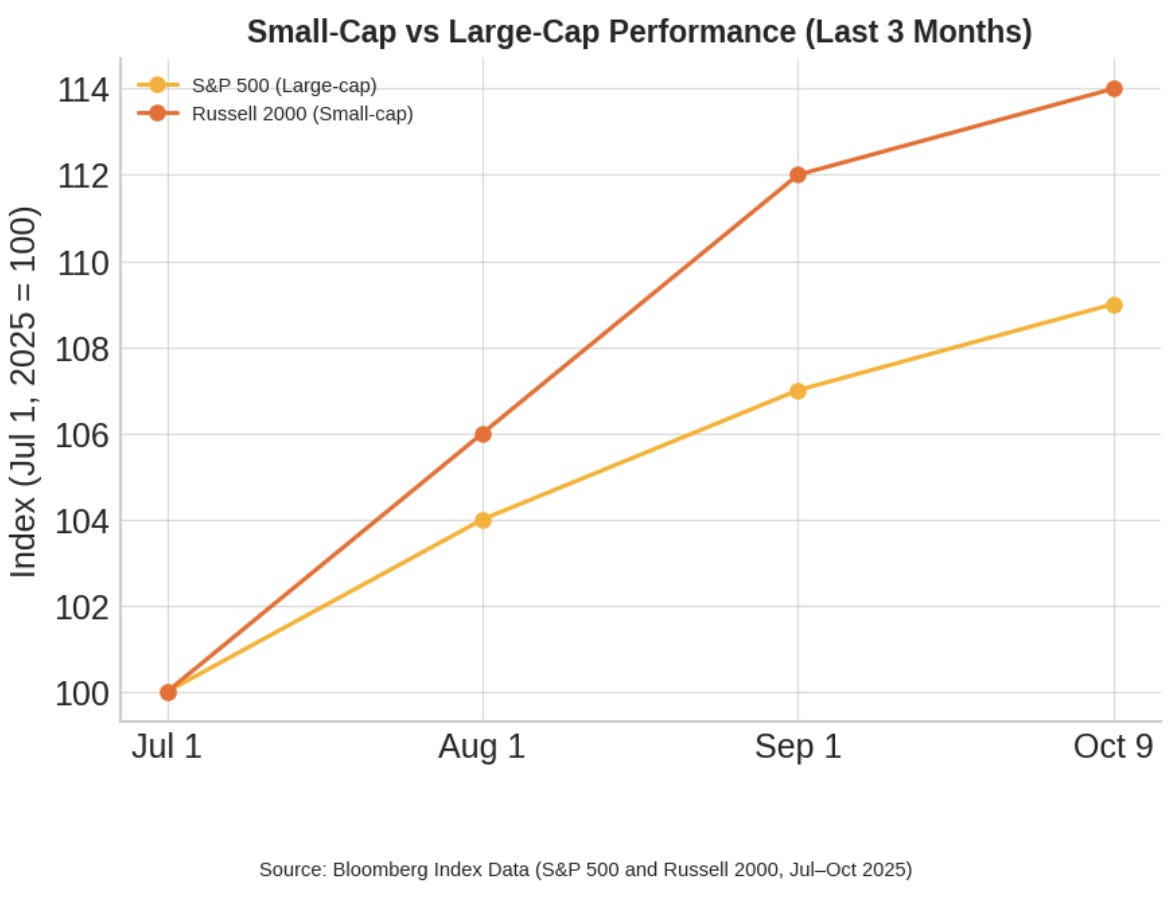
Underneath the surface, indications that risk appetite is fading can be seen. Small-cap stocks, which are particularly sensitive to credit conditions have slipped quietly lower in early October following a sharp surge in the third quarter⁴. These sorts of divergences, where small caps lag and large caps grind higher, have often signaled a broader pullback in markets historically. Marke

Comments 
In Channel
loading
00:00
00:00
1.0x

0.5x

0.8x

1.0x

1.25x

1.5x

2.0x

3.0x

Sleep Timer

Off

End of Episode

5 Minutes

10 Minutes

15 Minutes

30 Minutes

45 Minutes

60 Minutes

120 Minutes

Japan’s New Prime Minister Wants to Control the Central Bank — What Could Go Wrong

Japan’s New Prime Minister Wants to Control the Central Bank — What Could Go Wrong

Michael A. Gayed, CFA