DiscoverThe Lead-Lag ReportSmall Caps Gain Momentum as Fed Signals More Rate Cuts
Small Caps Gain Momentum as Fed Signals More Rate Cuts

Small Caps Gain Momentum as Fed Signals More Rate Cuts

Update: 2025-09-23
Share

Description

How To Interpret the Signals: Within each strategy, there is a risk-on and risk-off investment recommendation, with the risk-off option being the more conservative of the two. When a particular signal indicates that investors should be risk-off, for example, subscribers should consider investing in the risk-off option and avoiding the risk-on option. The opposite, therefore, would be true when the signal flips to risk-on. In each strategy, you’d always be invested in one option or the other.

Here’s how to read the scorecard for each strategy:

<figure>
<source type="image/webp" />october-9-2023-weekly-risk-signals
<svg class="lucide lucide-refresh-cw" fill="none" height="20" stroke="currentColor" stroke-linecap="round" stroke-linejoin="round" stroke-width="2" viewBox="0 0 24 24" width="20" xmlns="http://www.w3.org/2000/svg"><path d="M3 12a9 9 0 0 1 9-9 9.75 9.75 0 0 1 6.74 2.74L21 8"></path><path d="M21 3v5h-5"></path><path d="M21 12a9 9 0 0 1-9 9 9.75 9.75 0 0 1-6.74-2.74L3 16"></path><path d="M8 16H3v5"></path></svg>
<svg class="lucide lucide-maximize2 lucide-maximize-2" fill="none" height="20" stroke="currentColor" stroke-linecap="round" stroke-linejoin="round" stroke-width="2" viewBox="0 0 24 24" width="20" xmlns="http://www.w3.org/2000/svg"><polyline points="15 3 21 3 21 9"></polyline><polyline points="9 21 3 21 3 15"></polyline><line x1="21" x2="14" y1="3" y2="10"></line><line x1="3" x2="10" y1="21" y2="14"></line></svg>
</figure>

Some of the strategies will be more aggressive than others. The “Leverage For The Long Run” strategy, for example, uses the S&P 500 and 2x-leveraged S&P 500. The more conservative “Lumber/Gold Bond” strategy, however, uses intermediate-term Treasuries and the S&P 500. In every case, a risk-off signal indicates that you should be invested in the more conservative of the two options, while a risk-on signal indicates you should be invested in the more aggressive one.

For a full user's guide on how to interpret each of the signals and how to put them to work in your portfolio, please click HERE.

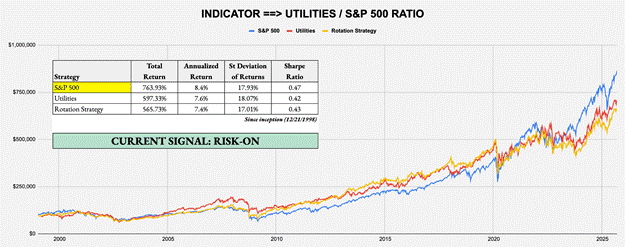
SHORT-TERM SIGNAL: UTILITIES/S&P 500 RATIO

Target Investor: Short-term traders with a higher risk tolerance interested in using an equity momentum strategy to anticipate changes in market risk tolerance.

Current Indicator: Risk-On

Strategy: Beta Rotation - Example: Invest in S&P 500 (SPY) over Utilities (XLU)

<figure>
<source type="image/webp" />
<svg class="lucide lucide-refresh-cw" fill="none" height="20" stroke="currentColor" stroke-linecap="round" stroke-linejoin="round" stroke-width="2" viewBox="0 0 24 24" width="20" xmlns="http://www.w3.org/2000/svg"><path d="M3 12a9 9 0 0 1 9-9 9.75 9.75 0 0 1 6.74 2.74L21 8"></path><path d="M21 3v5h-5"></path><path d="M21 12a9 9 0 0 1-9 9 9.75 9.75 0 0 1-6.74-2.74L3 16"></path><path d="M8 16H3v5"></path></svg>
<svg class="lucide lucide-maximize2 lucide-maximize-2" fill="none" height="20" stroke="currentColor" stroke-linecap="round" stroke-linejoin="round" stroke-width="2" viewBox="0 0 24 24" width="20" xmlns="http://www.w3.org/2000/svg"><polyline points="15 3 21 3 21 9"></polyline><polyline points="9 21 3 21 3 15"></polyline><line x1="21" x2="14" y1="3" y2="10"></line><line x1="3" x2="10" y1="21" y2="14"></line></svg>
</figure>

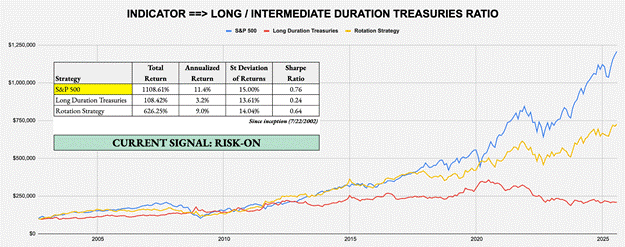
SHORT-TERM SIGNAL: LONG DURATION/INTERMEDIATE DURATION TREASURIES RATIO

Target Investor: Short-term traders with a higher risk tolerance who want to use the activity in the U.S. Treasury market to judge overall risk levels.

Current Indicator: Risk-On

Strategy: Tactical Risk Rotation - Example: Invest in S&P 500 (SPY) over Long-Term Treasuries (VLGSX)

<figure>
<source type="image/webp" />
<svg class="lucide lucide-refresh-cw" fill="none" height="20" stroke="currentColor" stroke-linecap="round" stroke-linejoin="round" stroke-width="2" viewBox="0 0 24 24" width="20" xmlns="http://www.w3.org/2000/svg"><path d="M3 12a9 9 0 0 1 9-9 9.75 9.75 0 0 1 6.74 2.74L21 8"></path><path d="M21 3v5h-5"></path><path d="M21 12a9 9 0 0 1-9 9 9.75 9.75 0 0 1-6.74-2.74L3 16"></path><path d="M8 16H3v5"></path></svg>
<svg class="lucide lucide-maximize2 lucide-maximize-2" fill="none" height="20" stroke="currentColor" stroke-linecap="round" stroke-linejoin="round" stroke-width="2" viewBox="0 0 24 24" width="20" xmlns="http://www.w3.org/2000/svg"><polyline points="15 3 21 3 21 9"></polyline><polyline points="9 21 3 21 3 15"></polyline><line x1="21" x2="14" y1="3" y2="10"></line><line x1="3" x2="10" y1="21" y2="14"></line></svg>
</figure>

INTERMEDIATE-TERM SIGNAL: LUMBER/GOLD RATIO

Target Investor: Short- and long-term investors willing to trade more frequently using the classic cyclical vs. defensive asset comparison.


Read more

Comments 
loading
In Channel
loading
00:00
00:00
1.0x

0.5x

0.8x

1.0x

1.25x

1.5x

2.0x

3.0x

Sleep Timer

Off

End of Episode

5 Minutes

10 Minutes

15 Minutes

30 Minutes

45 Minutes

60 Minutes

120 Minutes

Small Caps Gain Momentum as Fed Signals More Rate Cuts

Small Caps Gain Momentum as Fed Signals More Rate Cuts

Michael A. Gayed, CFA