


The World’s Biggest Empires of History, on One Epic Visual Timeline
Description
The World’s Biggest Empires of History, on a Visual Timeline
See visuals like this from many other data creators on our Voronoi app. Download it for free on iOS or Android and discover incredible data-driven charts from a variety of trusted sources.
Key Takeaways
- This visual timeline attempts to plot all of the world’s empires throughout history, based on geographic area and size.
- The rise and fall of familiar civilizations, like the Romans, Mongols, or Ottomans can be seen, as well as modern powerhouses like the U.S. or China.
- Attempting to plot this all on one timeline is bold, but also comes with its many challenges and some omissions.
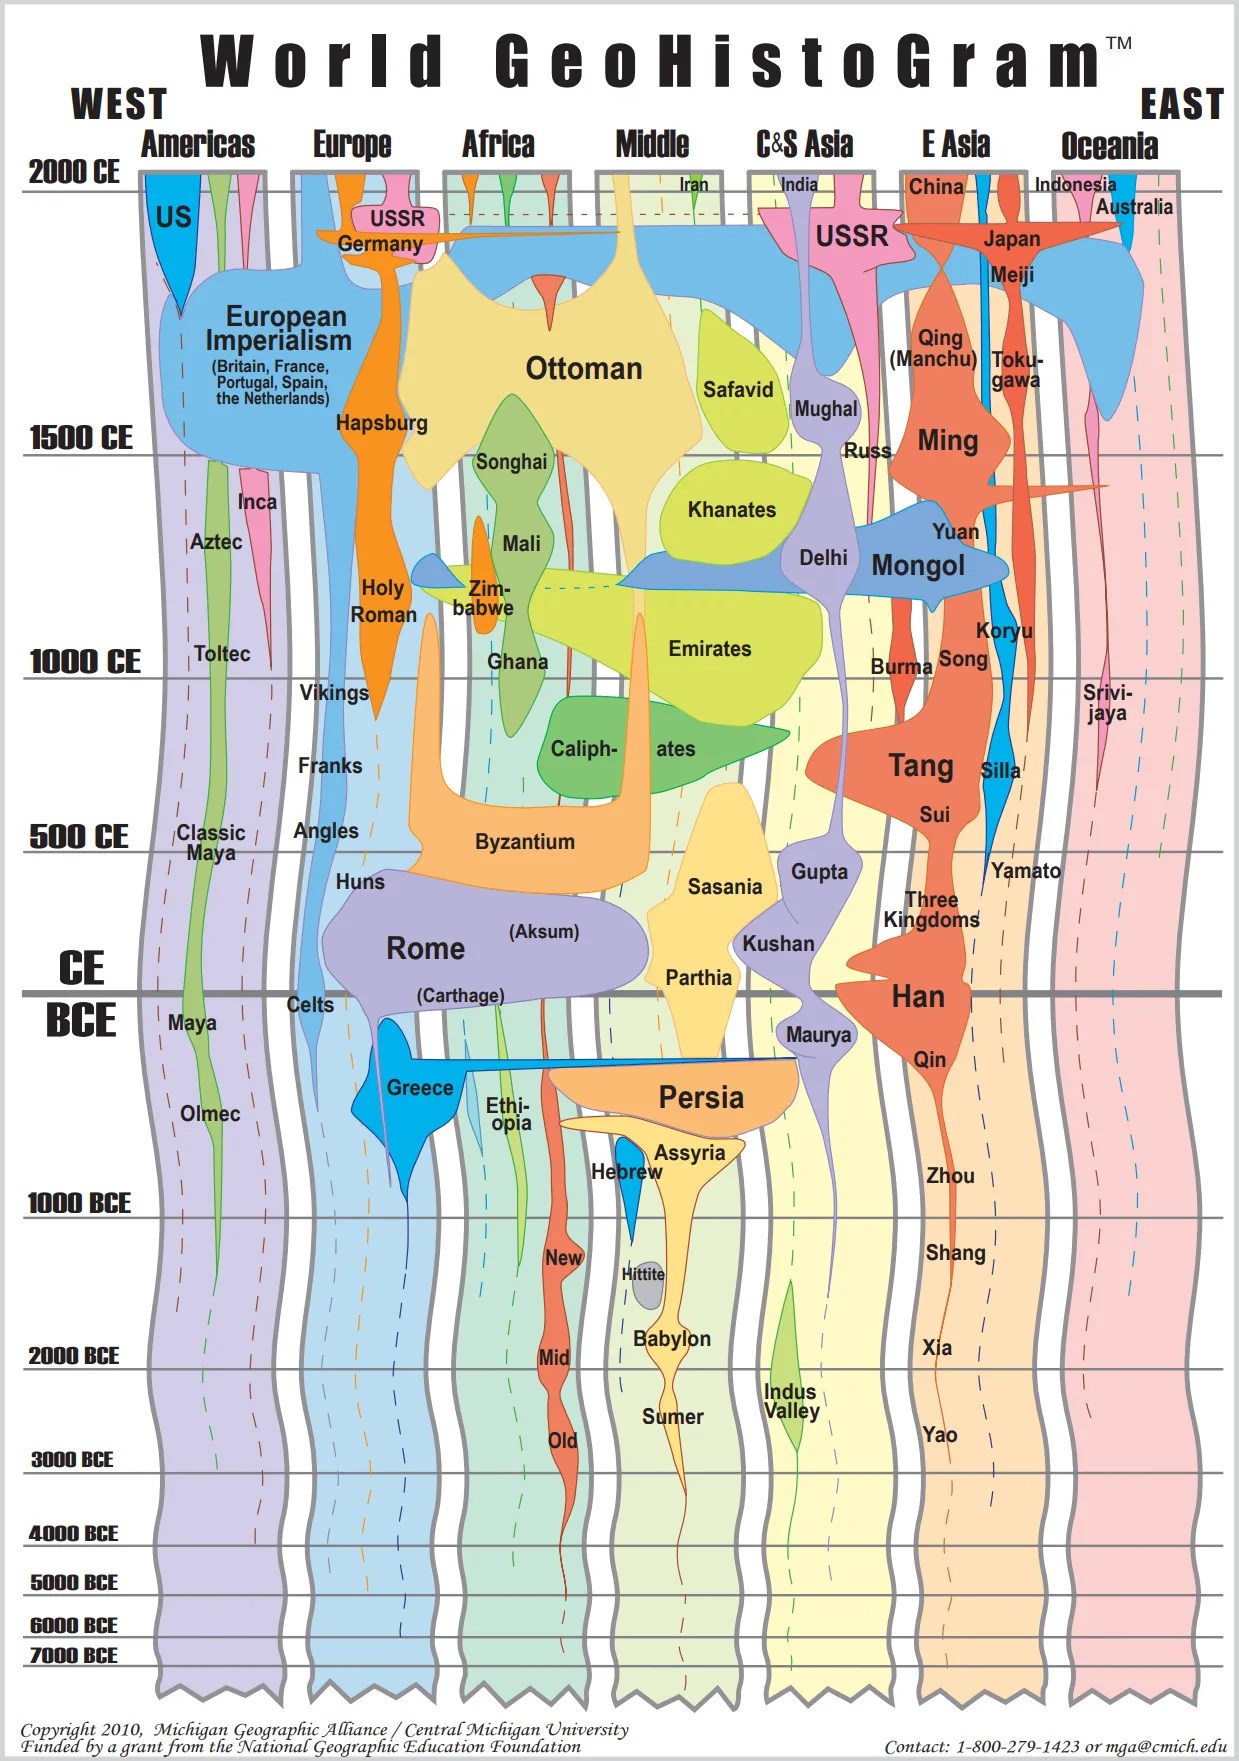
All of the world’s biggest empires. All on one timeline.
At least that was the goal set out to achieve with the World GeoHistogram, a teaching creation by the Michigan Geographic Alliance at Central Michigan University.
You can check out their teaching materials and educational resources at their website.
How the Visual Timeline Works
The World GeoHistogram combines geography and time into one unified visual framework that details the rise and fall of empires.
The diagram is composed of vertical columns representing broad world-geographic regions (i.e., Americas, Europe, Africa, Middle East, Central and South Asia, East Asia, Oceania). The vertical axis is time, and it is “tilted” so that time periods closer to modernity have more space and prominence.
Finally, the world’s biggest empires are plotted on the visual timeline, similar in spirit to the Histomap. Not only can you see the size and loose extent of an empire, but you can also use the GeoHistogram to make parallel connections between them that help tell the story.
Examples of Connections and Stories
There are no limits to the number of stories that can be made from the timeline, since it includes all of history. But here are a couple that stick out to us:
Alexander’s Conquest of Persia
Below you can see Ancient Greece’s very sudden and brief expansion, replacing Persia, in the timeline:

This represents Alexander the Great’s famous conquest, and subsequent fracturing of his kingdom into successor states. In this slab of the GeoHistogram, you can also see the rise of Rome, their conquering of Carthage, and their great rivals, the Parthians.
The Mongol Horde
Similar to the impact of Alexander, you can see the work of Genghis Khan in the following piece of the timeline:
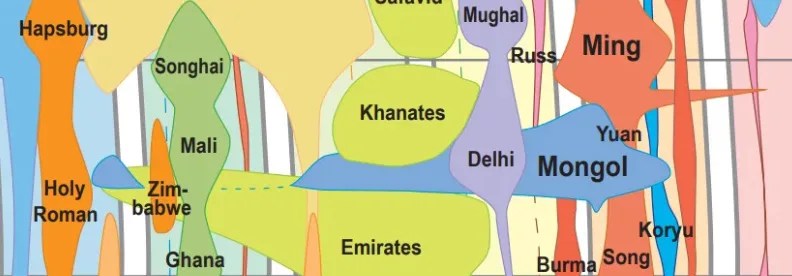
The Mongols come out of nowhere, and subsequently conquer most of Central Asia, East Asia, and parts of Europe, creating the largest contiguous land empire in history.
You can also see who their contemporaries were at the time of these conquests, like the Holy Roman Empire and Mansa Musa (one of the richest humans in history) of Mali.
Limitations
The World GeoHistoGram is a useful simplification, but its structure inevitably leaves out many societies that don’t fit the “large, literate empire” model.
Civilizations without centralized states, written records, or expansive territorial control—such as many Indigenous cultures in the Americas, Sub-Saharan Africa, Oceania, and the Arctic—are largely absent.
Likewise, influential nomadic confederations, regional city-states, and complex oral-tradition societies receive little or no representation. As a result, the GeoHistoGram can unintentionally reinforce a narrow view of world history that overlooks diverse, sophisticated civilizations outside the traditional imperial narrative.
Learn More on the Voronoi App 
What are the best selling books of history? See this visualization on Voronoi.


 United States
