


Visualizing Future Solar Power Capacity by Country
Description
Visualizing Future Solar Power Capacity by Country
See visuals like this from many other data creators on our Voronoi app. Download it for free on iOS or Android and discover incredible data-driven charts from a variety of trusted sources.
Key Takeaways
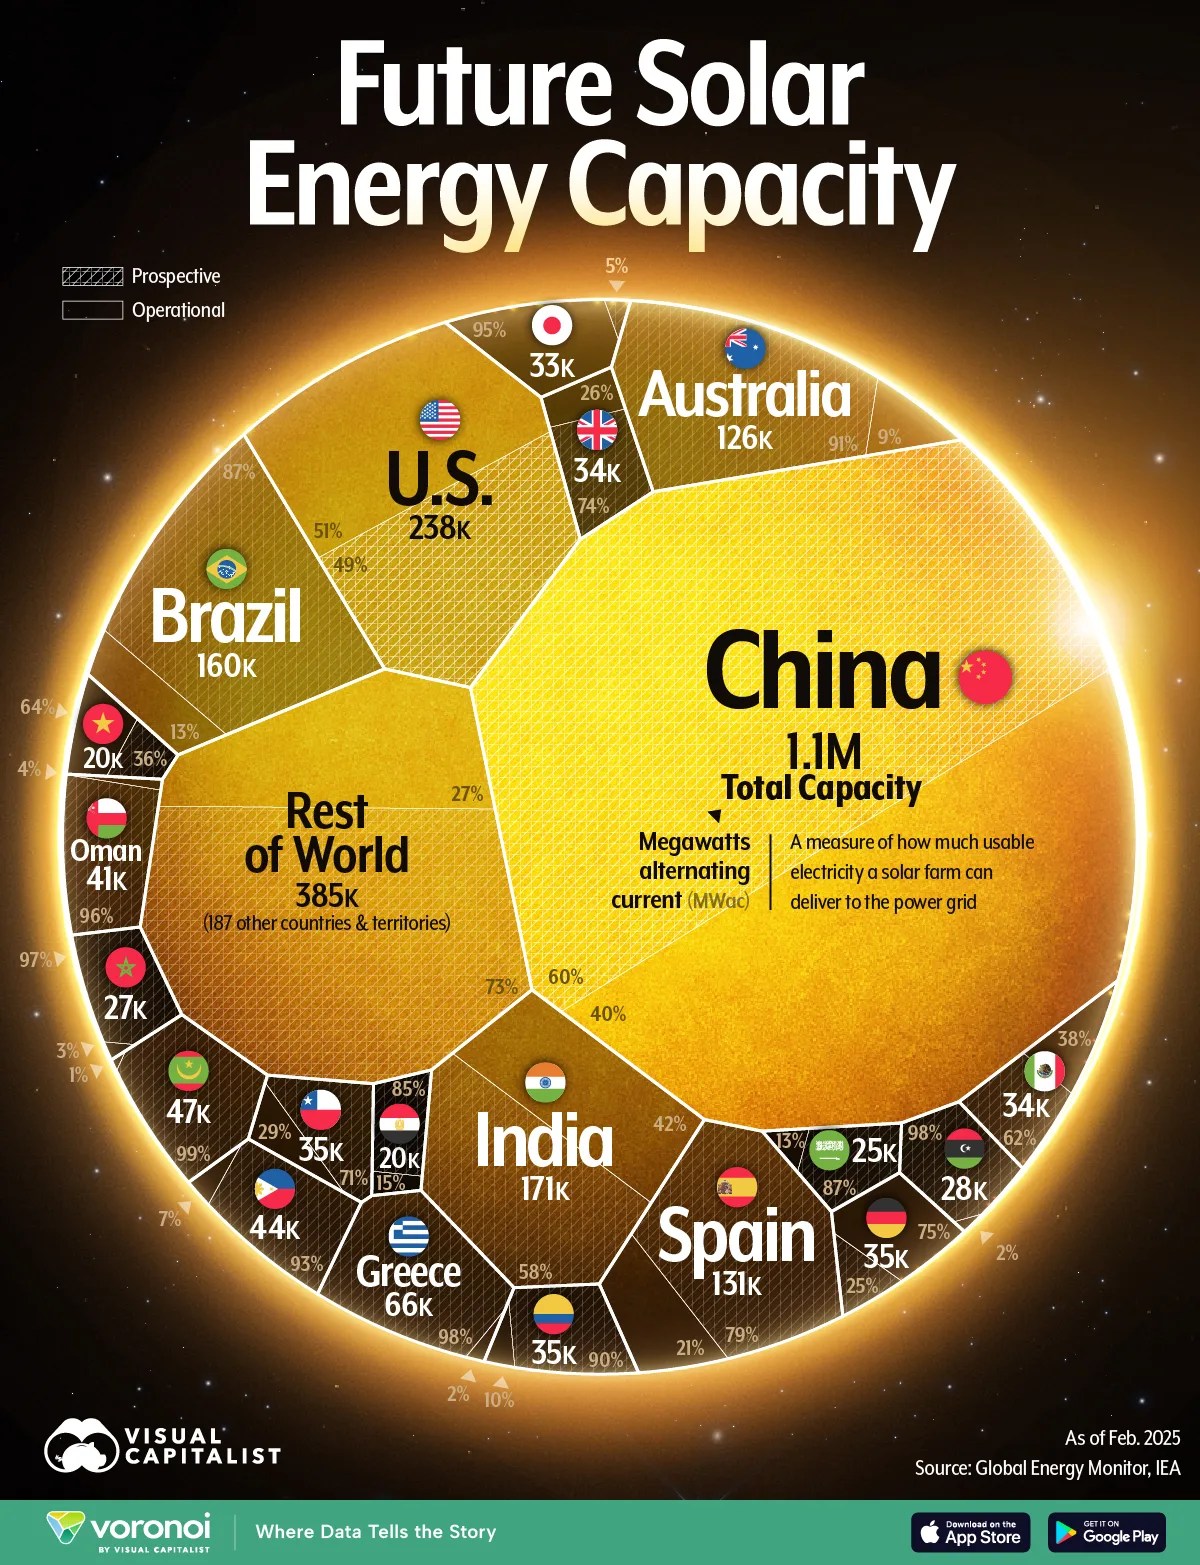
- With 671 GW of prospective solar capacity, China alone represents nearly 35% of the global pipeline, more than the next five countries combined.
- Countries like Mauritania, and Colombia have entered the top 15 recently.
- The top 15 countries account for over 80% of all planned solar capacity.
The global solar energy landscape is rapidly transforming as countries race to expand clean energy capacity. This visualization breaks down total solar power by country, combining both operational and prospective (planned) projects.
The data for this visualization comes from the Global Energy Monitor’s Solar Power Tracker. It compiles every known solar project around the world, measured in megawatts alternating current (MWac), a measure of how much usable electricity a solar farm delivers to the grid.
China Leads by a Massive Margin
Total global solar capacity, including all projects in construction and planned, is expected to reach almost 2.9 terawatts (TWac), with 80% concentrated in just 15 countries.
| Country | Operational (MWac) | Prospective | Total Capacity |
|---|---|---|---|
 China China | 447,508 | 670,935 | 1,118,442 |
 U.S. U.S. | 121,311 | 116,636 | 237,947 |
 India India | 72,300 | 98,442 | 170,742 |
 Brazil Brazil | 20,165 | 139,376 | 159,541 |
 Spain Spain | 28,014 | 103,062 | 131,076 |
 Australia Australia | 11,626 | 114,147 | 125,772 |
 Greece Greece | 1,397 | 64,512 | 65,908 |
 Mauritania Mauritania | 133 | 47,032 | 47,165 |
 Philippines Philippines | 3,188 | 40,359 | 43,547 |
 Oman Oman | 1,688 | 39,508 | 41,196 |
 Colombia Colombia | 3,451 | 31,955 | 35,406 |
 Germany Germany | 26,283 | 8,879 | 35,161 |
 Chile Chile | 9,982 | 24,830 | 34,812 |
 UK UK | 9,031 | 25,070 | 34,100 |
 Mexico Mexico | 12,787 | 20,943 | 33,731 |
 Japan Japan | 31,095 | 1,587 | 32,682 |
 Libya Libya | 460 | 28,039 | 28,499 |
 Morocco Morocco | 794 | 26,219 | 27,013 |
 Saudi Arabia Saudi Arabia | 3,305 | 21,363 | 24,668 |
 Egypt Egypt | 3,125 | 17,320 | 20,445 |
 Vietnam Vietnam | 12,902 | 7,305 | 20,207 |
 Rest of World Rest of World | 104,623 | 280,093 | 384,716 |
| Global Total | 925,166 | 1,927,613 |


