


“An Analogue Of Set Relationships For Distribution” by johnswentworth, David Lorell
Description
Audio note: this article contains 86 uses of latex notation, so the narration may be difficult to follow. There's a link to the original text in the episode description.
Here's a conceptual problem David and I have been lightly tossing around the past couple days.
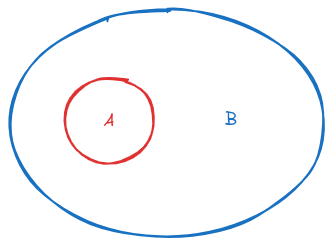
“A is a subset of B” we might visualize like this:
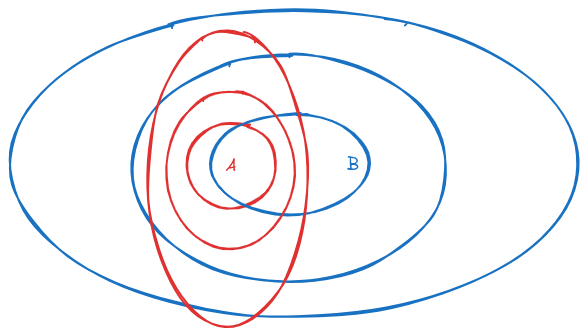
If we want a fuzzy/probabilistic version of the same diagram, we might draw something like this:
And we can easily come up with some ad-hoc operationalization of that “fuzzy subset” visual. But we’d like a principled operationalization.
Here's one that I kinda like, based on maxent machinery.
Background Concept 1: _E[-logP[X]] leq H_P(X)_ Encodes The Same Information About _X_ As _P_ Itself
First, a background concept. Consider this maxent problem:
_text{max}_{P’} -sum_X P’[X] logP’[X] text{ s.t. } -sum_X P’[X] logP[X] leq -sum_X P[X] logP[X]_
Or, more compactly
_text{maxent}[X] text{ s.t. } E[-logP[X]] leq H_P(X)_
In English: what is the maximum entropy distribution _P’_ for which (the average number of bits used to encode a sample from _P’_ using a code optimized for distribution _P_) is at most (the average number of bits used to encode a sample from _P_ using a code optimized for _P_)?
The solution [...]
---
Outline:
(01:10 ) Background Concept 1: _E\[-logP\[X\]\] \\leq H_P(X)_ Encodes The Same Information About _X_ As _P_ Itself
(02:35 ) Background Concept 2: ... So Let's Use Maxent To Fuse Distributions?
(05:48 ) Something Like A Subset Relation?
---
First published:
November 18th, 2025
Source:
https://www.lesswrong.com/posts/wBpguFgkygpQEGSyX/an-analogue-of-set-relationships-for-distribution
---
Narrated by TYPE III AUDIO.
---
Images from the article:
Apple Podcasts and Spotify do not show images in the episode description. Try Pocket Casts, or another podcast app.


 United States
