


” by ryan_greenblatt")
“Measuring no CoT math time horizon (single forward pass)” by ryan_greenblatt
Description
A key risk factor for scheming (and misalignment more generally) is opaque reasoning ability.
One proxy for this is how good AIs are at solving math problems immediately without any chain-of-thought (CoT) (as in, in a single forward pass).
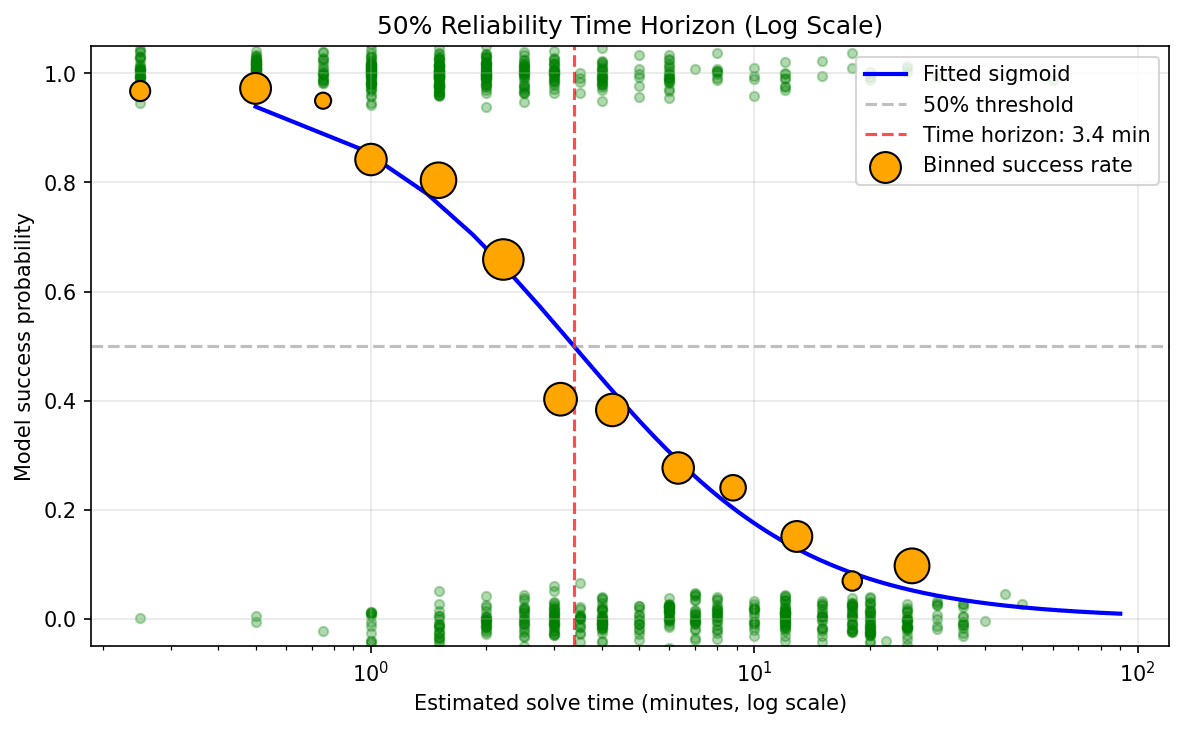
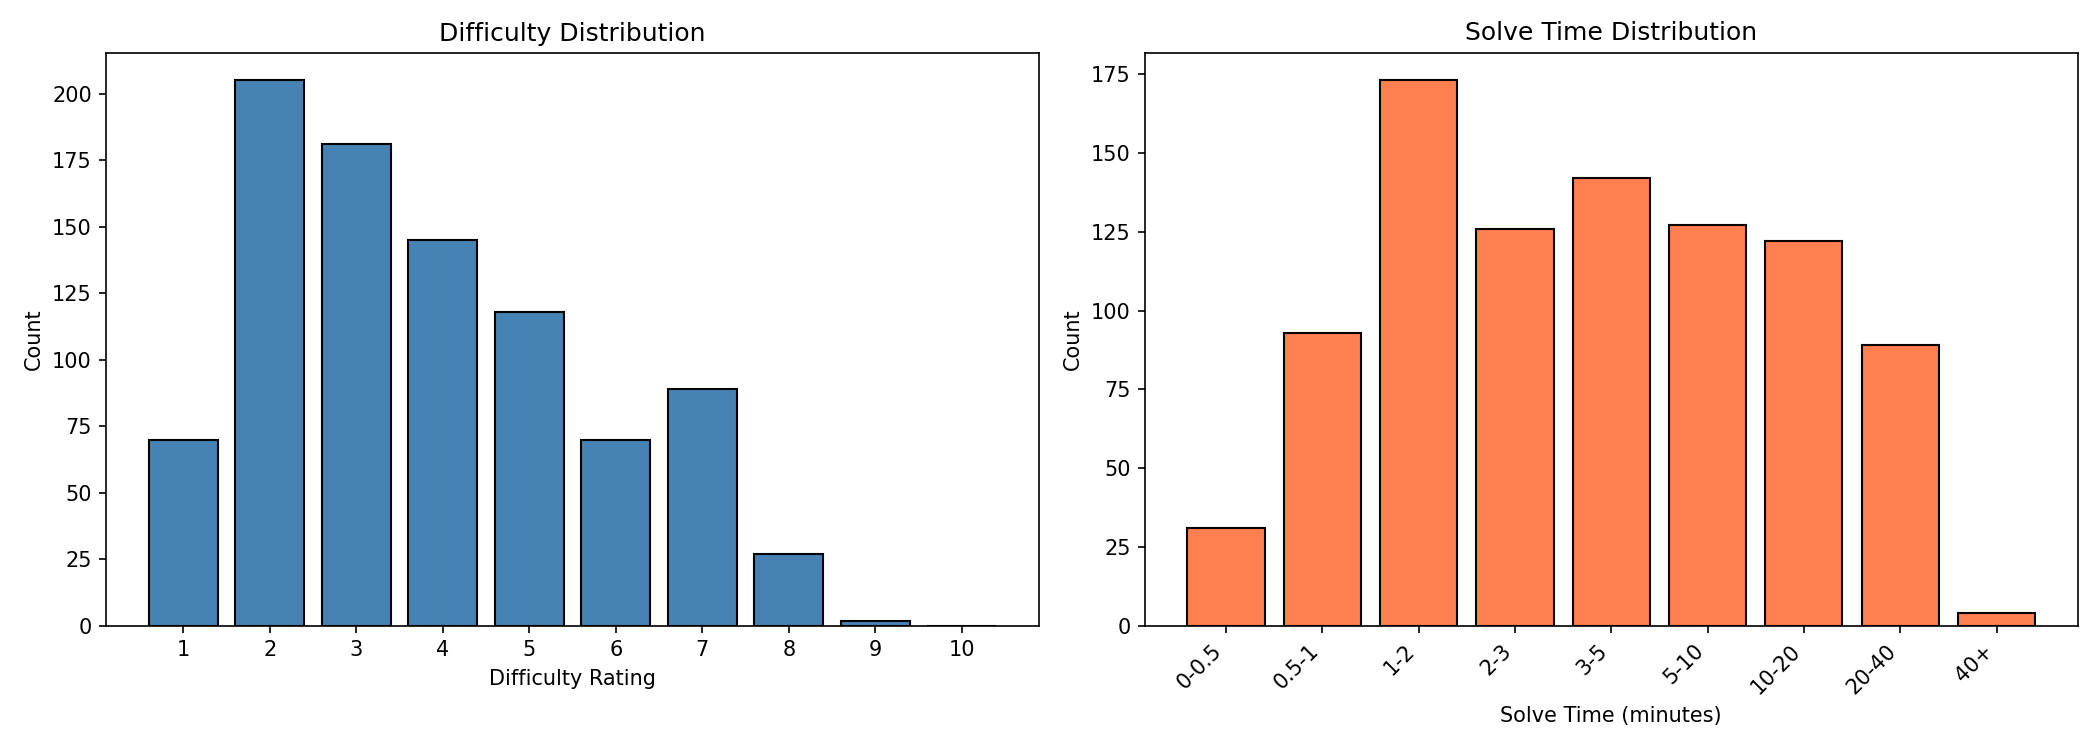
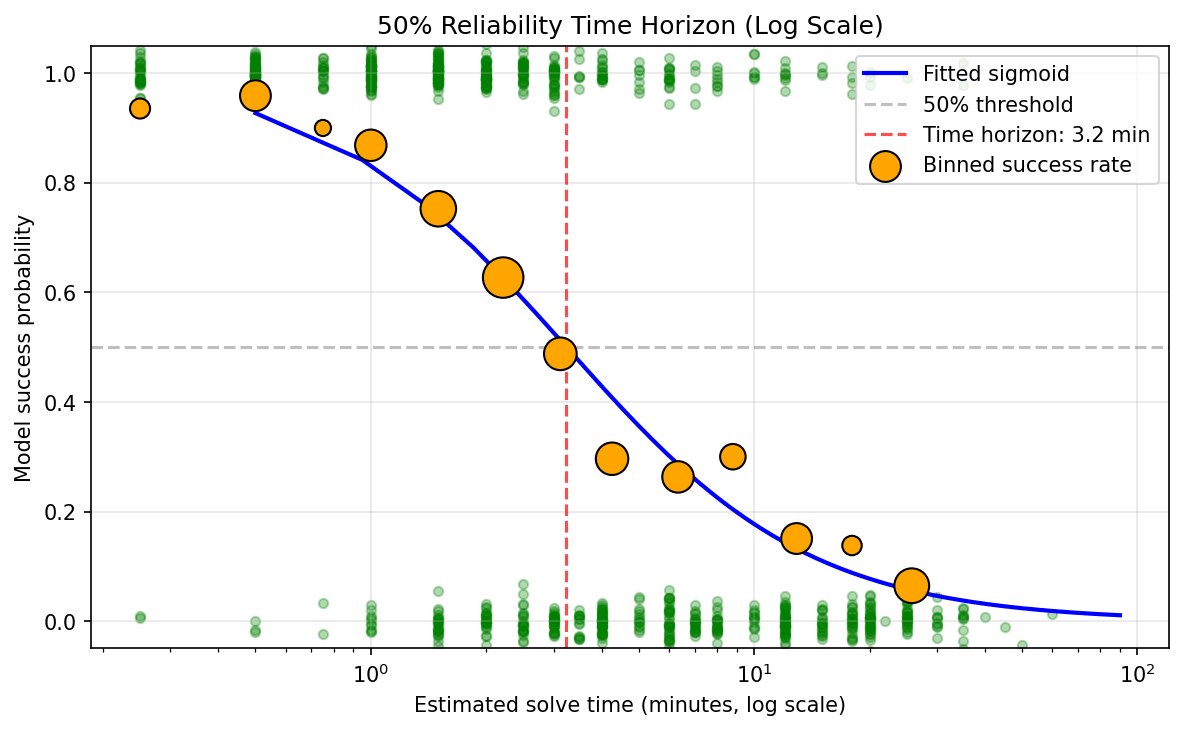
I've measured this on a dataset of easy math problems and used this to estimate 50% reliability no-CoT time horizon using the same methodology introduced in Measuring AI Ability to Complete Long Tasks (the METR time horizon paper).
Important caveat: To get human completion times, I ask Opus 4.5 (with thinking) to estimate how long it would take the median AIME participant to complete a given problem.
These times seem roughly reasonable to me, but getting some actual human baselines and using these to correct Opus 4.5's estimates would be better.
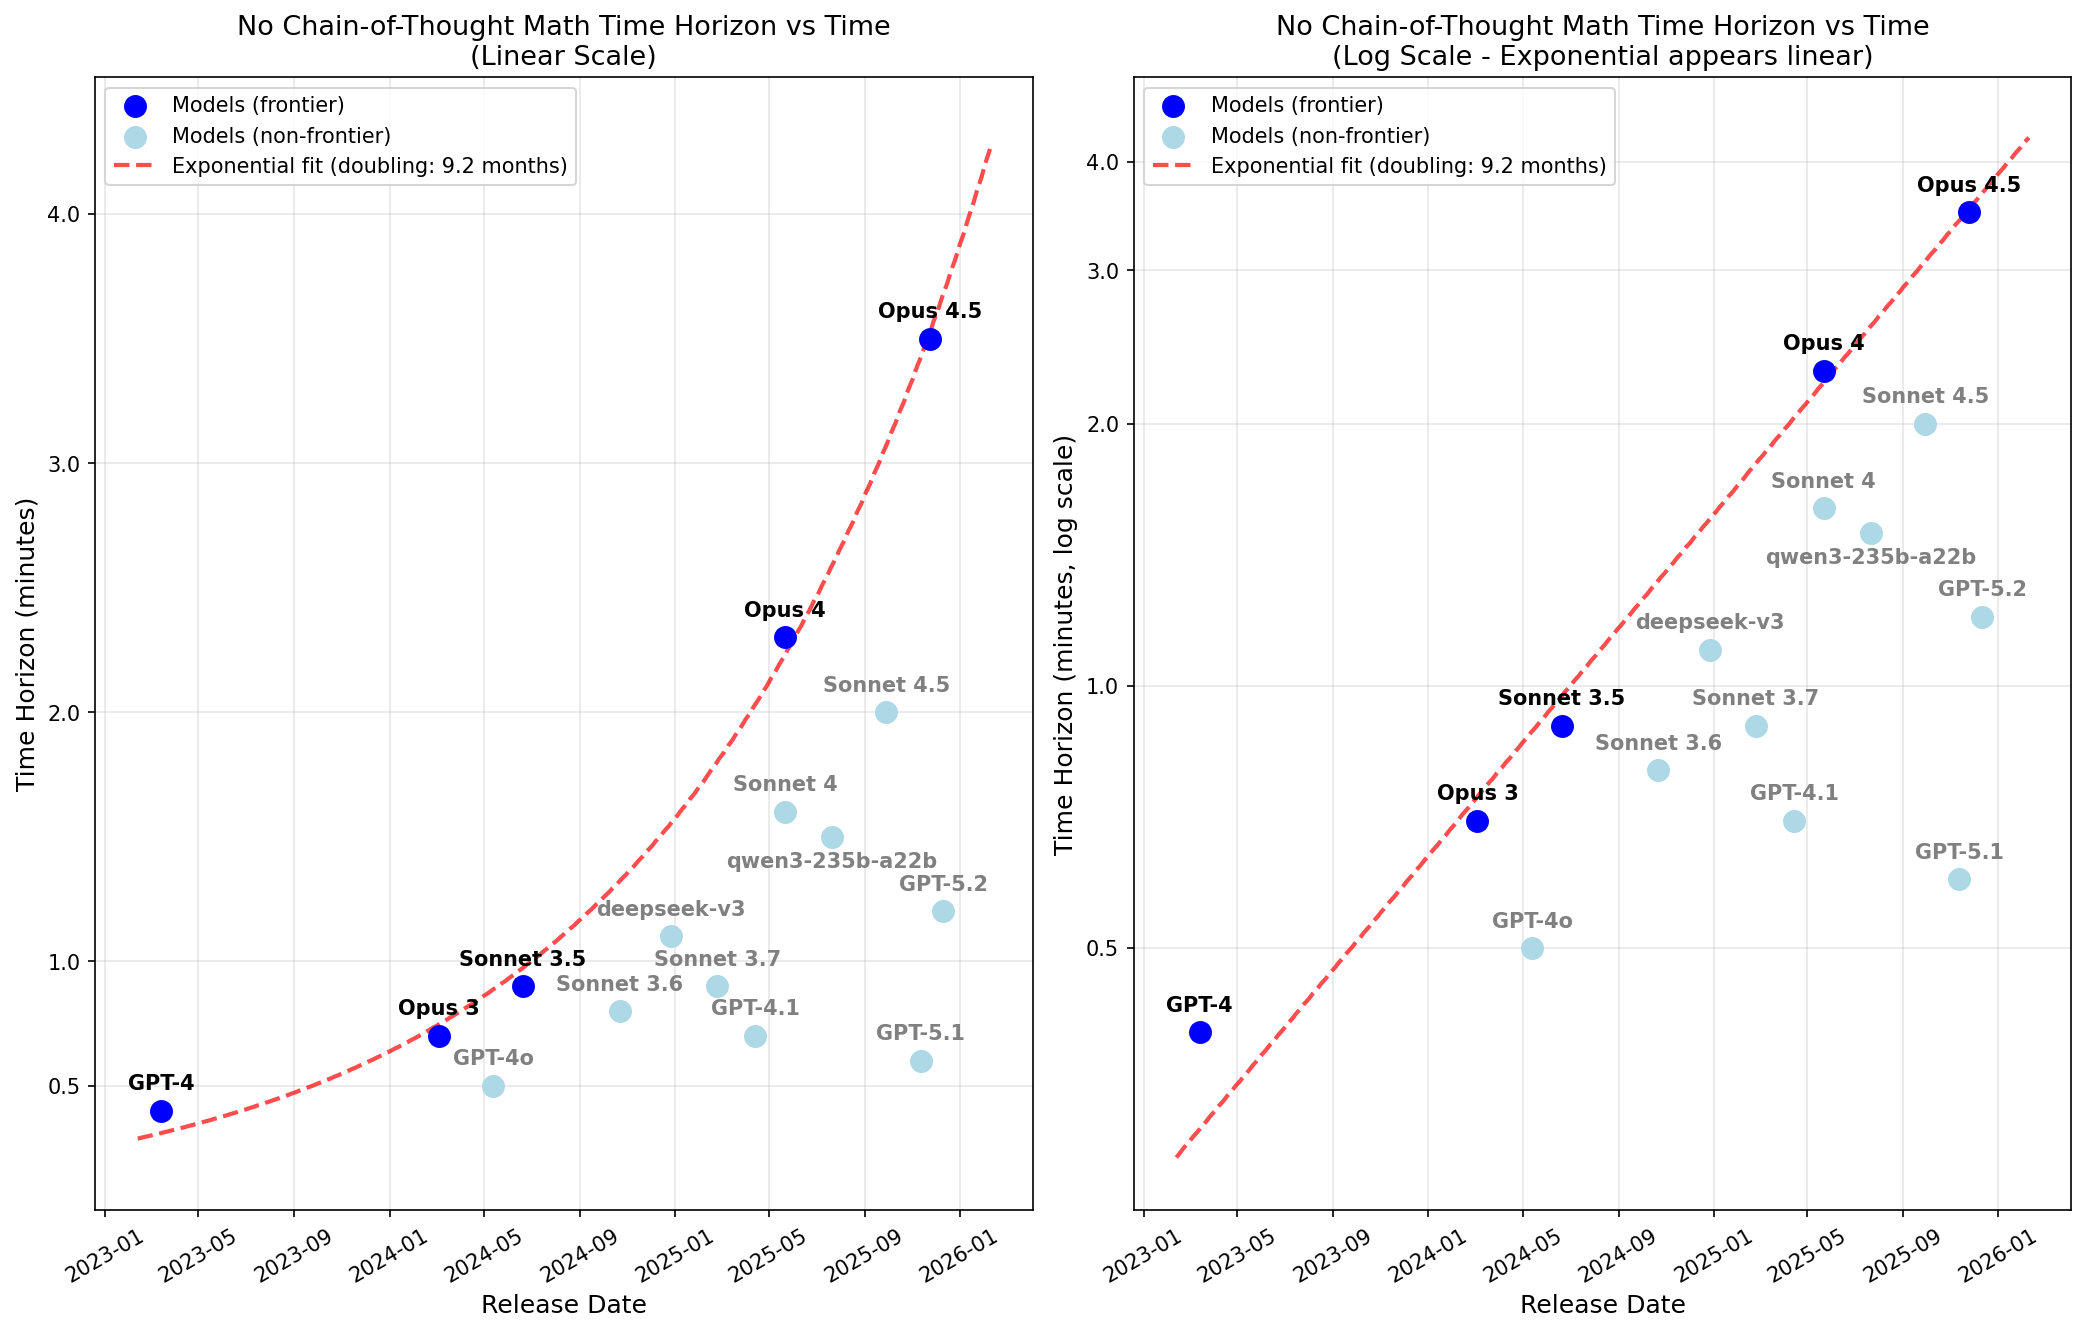
Here are the 50% reliability time horizon results:
I find that Opus 4.5 has a no-CoT 50% reliability time horizon of 3.5 minutes and that time horizon has been doubling every 9 months.
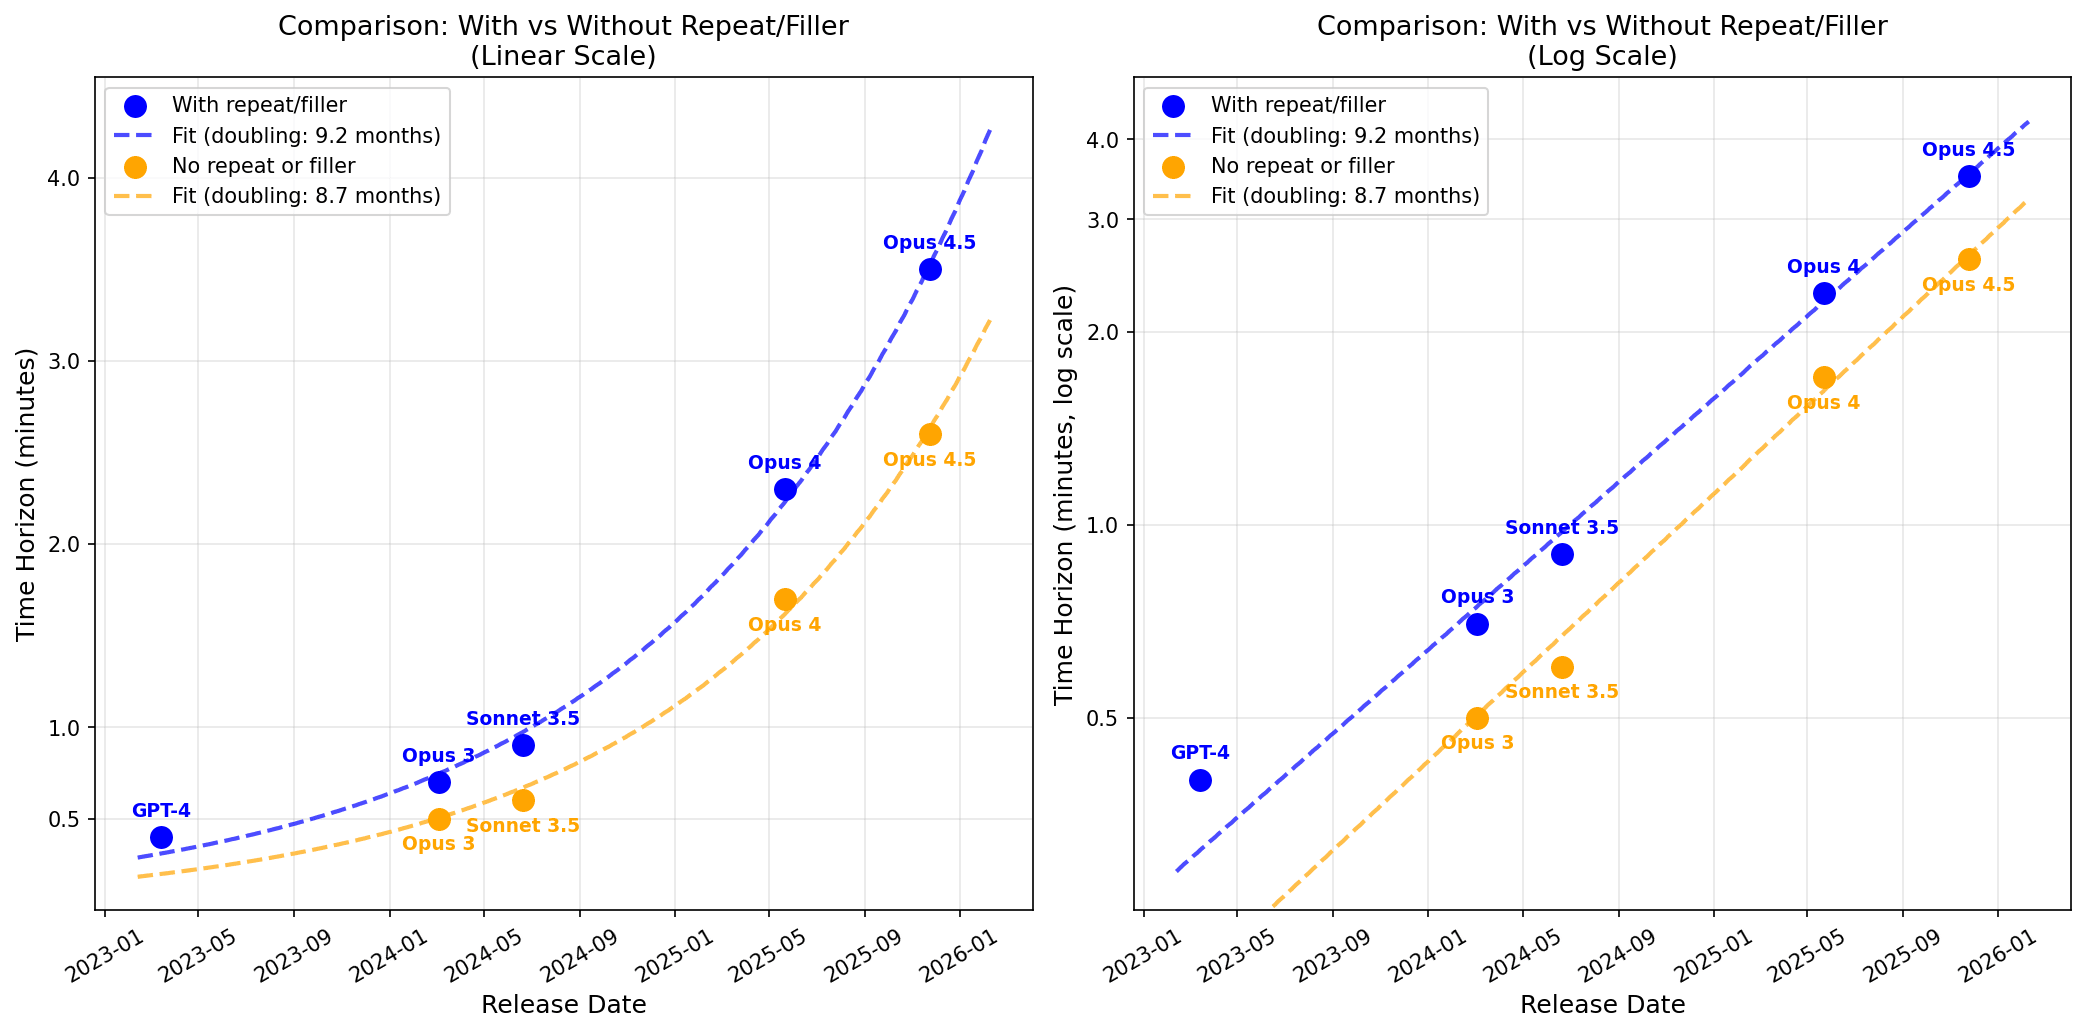
In an earlier post (Recent LLMs can leverage filler tokens or repeated problems to improve (no-CoT) math performance), I found that repeating the problem substantially boosts performance.
In the above plot, if [...]
---
Outline:
(02:33 ) Some details about the time horizon fit and data
(04:17 ) Analysis
(06:59 ) Appendix: scores for Gemini 3 Pro
(11:41 ) Appendix: full result tables
(11:46 ) Time Horizon - Repetitions
(12:07 ) Time Horizon - Filler
The original text contained 2 footnotes which were omitted from this narration.
---
First published:
December 26th, 2025
---
Narrated by TYPE III AUDIO.
---
Images from the article:
Apple Podcasts and Spotify do not show images in the episode description. Try Pocket Casts, or another podcast app.


 United States
