


SDG #12 - Responsible Consumption and Production
Description
sqs-block-image-figure
intrinsic
">
</figure>
<figure class="
sqs-block-image-figure
intrinsic
">
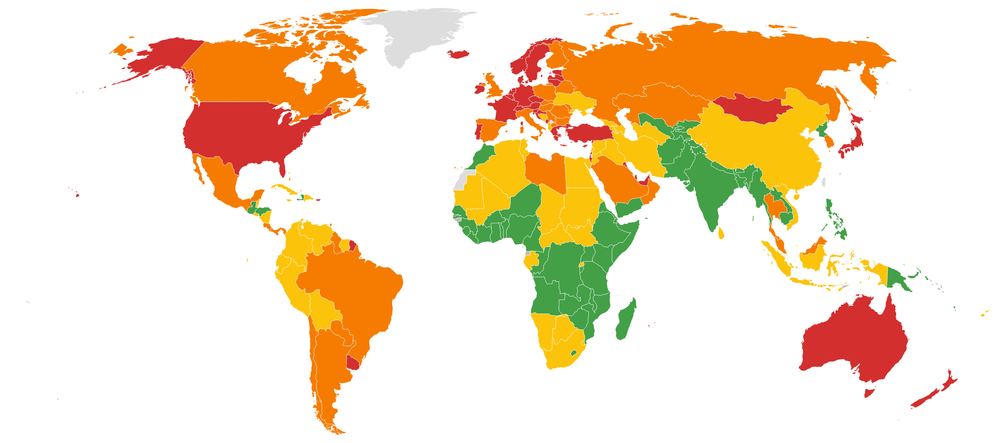
<figcaption class="image-caption-wrapper">
Dashboard map for 2022 SDG Index Goal #12 ratings. Data source: sdgindex.org
</figcaption>
</figure>
Electronic waste (kg/capita)
This Goal and indicator’s 2022 score results paint an ugly portrait of the industrialised world. Most Goals heretofore align with poverty or inequality, though Goal's #12 to #15 focus on the environmental pillar of sustainable development. The environmental Goals are scathing of the developed countries, an inverse phenomenon whereby sub-Saharan Africa and South Asia are often on track, and the high-income countries score red.
The definition for this e-waste indicator is waste of both an electric and electronic nature e.g., TVs, mobile phones, computers and computer accessories, game consoles and printers
Be mindful about your disposal of electronic and electric waste, beginning from the initial purchase. Assess whether you need an item in the first place, flowing through to the care given to it after purchase. Once it has ceased to serve your ends, are you able to find another life for it? Could you donate it to a charity shop, or even strip it of its components? You can research if there’s a facility taking e-waste in your local area. Many of us have encountered the alliterative ‘reduce, reuse, recycle’ - though hackneyed as it is, it holds merit vis-a-vis e-waste.
Summary: Limit your e-waste to 0.2kg or less per year by 2030.
Production-based SO₂ emissions (kg/capita)
This indicator measures emissions of sulphur dioxide from the production of goods and services (in contrast to natural emissions, e.g., volcanoes). Sulphur dioxide is one sulphur atom attached to two oxygen atoms. When you light a match, burning sulphur, the smell is sulphur dioxide.
Those who may take part in the production of sulphur dioxide may be those working in industries and occupations burning sour gas and sour crude - both instances of fossil fuels bearing considerable amounts of sulphur. The extraction of copper can lead to emissions of SO₂, as can cement production, and the process of producing sulphuric acid. The biggest sources though are burning fossil fuels, smelting and metals processing. Rather than being a greenhouse gas itself, fossil fuels contain this polluting chemical, which can result in acid rain. We already know we should be decarbonising and shifting to renewable energy. Part of the global decarbonisation path will be decarbonising industrial processes, reducing the emissions of SO₂ in the process.
Only Kuwait scored red in the 2022 Index, with emissions counted as those consumed from production, as well as exports.
Summary: For readers in countries off-track working in the fossil fuel industry, or other heavy industry, end emissions of sulphur dioxide by 2030.
SO₂ emissions embodied in imports (kg/capita)
The 2030 aim for this indicator is to end the emissions of sulphur dioxide embodied in imports, aiming for citizens of countries off-track to end the outsourcing of emissions to countries off-track from the previous indicator. We learned in the previous indicator this means cutting back on the use of fossil fuels, as well as cement and metals production. It asks you to reconsider your use of goods and services using these inputs. We’ll discuss further the impacts this may have on the country which originated the embodied emissions within SDG #13 - the same principle for sulphur dioxide will hold up for carbon dioxide emissions.
Summary: For readers in countries off-track, seek alternatives to imports by 2030 of fossil fuel, cement, and metals from countries off-track in the prior indicator.
Production-based nitrogen emissions (kg/capita)
This is another ‘production-based’ indicator, akin to the indicator we looked at earlier relating to production-based sulphur dioxide. The indicator’s 2030 aim is to reduce production-based nitrogen emissions to 2 kilograms per capita.
In SDG #2, we explored the indicator for the Sustainable Nitrogen Management Index, and the importance of balancing the Earth’s nitrogen cycle. One of the major greenhouse gases is nitrous oxide, a compound of nitrogen, often emitted from agricultural soil, in tandem with the use of fertilisers. Nitrogen is essential to food production to provide nutrition to the plants, but it pollutes the ecosystem. It’s often overlooked that agriculture is a key driver of the greenhouse effect causing climate change, albeit without the nefarious reputation of fossil fuels. We need to recognise agriculture for its contribution to greenhouse gas emissions, often in the form of methane emissions from livestock, or even deforestation to clear land for agricultural use.
This indicator measures a country's nitrogen emissions according to production for domestic consumption, as well as export, including nitrogen compounds such as:
ammonia (one nitrogen atom and three hydrogen atoms)
nitrogen oxide (a family of compounds with different combinations of nitrogen and oxygen atoms)
nitrous oxide (two nitrogen atoms and one oxygen atom)
The kind of nitrogen compounds this indicator measures are reactive nitrogen compounds, meaning they support the growth of life. Unreactive nitrogen exists in the environment, only supporting some growth. Reactive nitrogen supports the conversion of proteins within plant life, leading to a loss of oxygen. In bodies of freshwater, this leads to a process known as eutrophication, overwhelming water bodies with nutrients, sometimes developing algal blooms, creating a dead zone for other life forms living in the water.
Summary: For readers in countries off-track, especially those working in agriculture, limit individual annual emissions of reactive nitrogen to 2kg by 2030.
Nitrogen emissions embodied in imports (kg/capita)
The previous indicator focused on attributing emissions related to nitrogen production - this indicator looks at the other side of the equation i.e., demand for goods causing nitrogen emissions in the form of imports.
A research team studied the origin of nitrogen emissions, finding developed countries drove demand. So, what can readers from developed countries scoring red or orange for this indicator do to reduce their demand for embodied imports of nitrogen? Few of us think of ourselves as being responsible for the import of nitrogen and its compounds, but what goods and services will you find it in? The focus is on agriculture, in particular meat and dairy consumption as a driver. This is due to the implications of nitrogen-based fertiliser use, as well as intensive farming and food waste, because the runoff of the fertiliser in the soil makes its way into the water cycle. The textile industry is also a major driver of embedded emissions, especially leather, furs, and down feathers.
Summary: For all readers, seek alternatives to imports by 2030 of meat, dairy and manufactured products from countries off-track for the prior indicator.
Exports of plastic waste (kg/capita)
Would you believe the mass of plastic on our planet outweighs the biomass of all living things? This indicator measures exported kilograms of plastic waste per capita, with many OECD countries off-track as of 2022. Across a total population, the biggest exporter of plastic waste for 2021 were Germany, Netherlands and Japan, each exporting more than 600 million kilograms. The biggest plastic waste exporter per capita however is Belgium, exporting 29 kg per Belgian over the past five years.
The biggest plastic polluter overall is China, accounting for an estimated quarter of plastic waste ending up in the oceans, followed by Indonesia with a tenth of the global total. Howe


 United States
