


SDG #6 - Clean Water and Sanitation
Description
sqs-block-image-figure
intrinsic
">
</figure>
<figure class="
sqs-block-image-figure
intrinsic
">
<figcaption class="image-caption-wrapper">
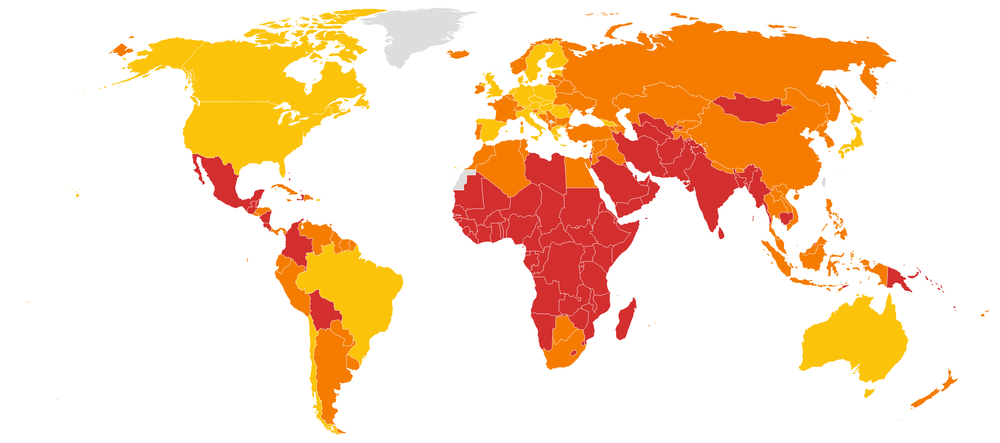
Dashboard map for 2022 SDG Index Goal #6 ratings. Data source: sdgindex.org
</figcaption>
</figure>
Population using at least basic drinking water services (%)
As of 2020, 90% of the world has basic drinking water services, with a steady upward trend since the start of the MDG period. Yet the 10% left over is still too much, with the 2022 SDG Index scores showing us the LDCs scoring red for this indicator. We’re aiming for 100% of the population to use basic drinking water services, defined as an ‘improved source’, meaning due to its “design and construction it has the potential to deliver safe water”. This definition is further categorised by whether the water is accessible on the premises, available when needed, and free from contamination.
Types of unimproved sources include:
unprotected springs and wells
surface water from sources such as rivers, dams, lakes, streams, and irrigation canals
An example of an improved source is:
water piped to the home
protected wells and springs
harvested rainwater
packaged or delivered water
Per the definition of this indicator, a ‘basic drinking water service’ is an ‘improved water source’, requiring a 30-minute or less round trip, including queuing. The definition of a source taking longer is ‘limited’, in contrast to ‘basic’.
To make this a little easier to conceptualise, UNICEF and the WHO use a ladder of drinking water:
<figure class="
sqs-block-image-figure
intrinsic
">

<figcaption class="image-caption-wrapper">
Source: https://washdata.org/monitoring/drinking-water
</figcaption>
</figure>
Consider the role drinking water has in your life, and how you depend on its quality. You rely on it for basic survival, secondary in urgency to oxygen. Our planet’s surface area is 71% water, but 96.5% of this is saline, with only 2.5% fresh water.
Diarrhoea is the second leading cause of death of children under 5, killing over half a million every year. Imagine your parents conceiving you, brought to term by your mother, only losing you to diarrhoea within 5 years of birth. When I picture the children in my life below age 5, the thought of them dying is shocking. If the cause were something as feeble and preventable as diarrhoea, it’d be even more senseless.
How are you going to respond to this challenge to make up the shortfall of the 10% of the global population without basic drinking water services? You’re a step ahead of me. You’ve already concluded that because the countries far off-track are LDCs, the responsibility falls upon the DAC country readers to finance what's required to provide basic drinking water services.
The main point is providing quality drinking water up to the standard of the ‘basic’ rung on the above ladder, meaning free of pollution, including when the pollutants originate from the original groundwater.
Summary: For OECD country readers, affirm your annual commitment to give 0.7% of your gross income as aid, aiming for all to have at least basic drinking water services by 2030.
Population using at least basic sanitation services (%)
A similar worded indicator to before, albeit focused upon sanitation, in contrast to drinking water, aiming for 100% coverage of a population using basic sanitation, to bridge the gap of 78% of the world population.
The definition of an improved facility is designed to separate human waste from human contact, meaning it’s:
not shared with other households
treats the waste and disposes of it on-site
stored, then emptied, and treated off-site
transported via a sewer along with wastewater, and treated off-site
Examples of improved sources include:
flush toilets (connected to a sewer, septic tank, or pit latrine)
pit latrines, with slabs covering the pit
composting toilets
UNICEF and the WHO likewise has a ladder for sanitation, as it does for drinking water:
<figure class="
sqs-block-image-figure
intrinsic
">

<figcaption class="image-caption-wrapper">
Source: https://washdata.org/monitoring/sanitation
</figcaption>
</figure>
What to do? We’ll follow the same prescription as above for water, with LDC countries cared for by the foreign aid donations from our DAC readers.
What about middle-income countries? As mentioned earlier, DAC aid reaches recipients beyond the LDCs prioritised as neediest, but for this indicator, we have middle-income countries with portions of the population still living in extreme poverty. South Asia has scored red in the 2022 SDG Index for this indicator, as have Mongolia, Papua New Guinea, Bolivia, Nicaragua and Guatemala.
Let’s lean on the ability of foreign aid to resolve this. In the event you’re reading this perched on the stilts of a hanging latrine, then above is the standard of what’s required for a ‘basic’ sanitation service where you live to help you to meet this indicator of 100% of the population.
Summary:
For OECD country readers, affirm your annual commitment to give 0.7% of your gross income as aid, aiming for all to have at least basic sanitation services by 2030.
For readers in countries off-track, use a basic sanitation service from an improved sanitation facility, where available.
Fresh


 United States
