


SDG #17 - Partnerships for the Goals
Description
sqs-block-image-figure
intrinsic
">
</figure>
<figure class="
sqs-block-image-figure
intrinsic
">

<figcaption class="image-caption-wrapper">
Dashboard map for 2022 SDG Index Goal #17 ratings. Data source: sdgindex.com
</figcaption>
</figure>
Government spending in health & education (% of GDP)
This measure looks at the portion of government spending (i.e., your tax dollars) on health and education, measured as a percentage of the whole GDP, aiming by 2030 for 15% of national GDP spent on health and education. Cuba takes the gold, with 23% of GDP spent by the government on health and education. The percentage of global government spending on health and education alone is almost 9.6% as of 2018, with zero growth since 2015.
Education and health are but another measure of poverty outside of income. This is reflected in the Human Development Index (HDI), which is similar to the SDG Index. The HDI creates a composite index of human development, measuring GDP per capita, life expectancy at birth, and years of education.
This indicator is in the hands of the government to act. Your task, as a singular citizen, is to call or write a letter to your government representative, requesting they increase the portion of spending on health and education to 15% by 2030.
Governments have national accounts, like the accounts of a business. They have debts like a business, and collect revenue in the form of tax or duties on imported goods. To manage all these flows of money through their accounts, governments develop fiscal policies guiding how they intend to raise revenues. Fiscal policy guides whether to levy taxes or cut them. On the other hand, the fiscal policy directs how to spend or invest the revenue. Different countries' governments have different fiscal policies regarding how much of their revenue they decide to spend, also differing on what to spend it on.
What a government wants to spend their money on may differ to what they do spend their money on - what they can afford may instead decide this. Many LDC governments, of course, are aware of the priority of poverty alleviation, and the necessary spending required. But if the citizens are too poor to tax, then the government will have little money to spend on what they know is needed to improve the standard of living of their people.
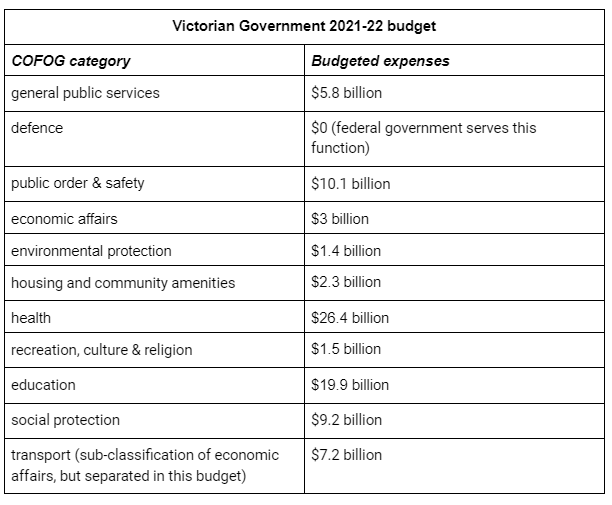
The Classification of the Functions of Government (COFOG) comprises 10 categories. Below, I’ve used my home state’s 2021-22 budget, categorised according to this classification for illustrative purposes, with figures in Australian dollars:
<figure class="
sqs-block-image-figure
intrinsic
">
<figcaption class="image-caption-wrapper">
Source: https://www.dtf.vic.gov.au/state-budget/2021-22-state-budget
</figcaption>
</figure>
As we see, the classifications of health and education are the biggest categories of expenditure. But the above example also offers us an insight into what other competing classifications vie for expenditure.
How can readers contribute toward this indicator? They’re unable to affect the national government’s budgetary spending, other than by their votes at the ballot box. With regards to the LDCs, the contribution of aid championed throughout these pages ought to cover this shortfall. Readers could aim to apportion, by 2030, 15% of their gross income toward their own health and education spending. Given your circumstances, I’m uncertain what expenses this 15% of income may come at the expense of. If your country scored red for this indicator, your government’s been unable or unwilling to provide enough of a safety net in the vital fields of health and education to uphold the most important pillars of your wellbeing. You should prioritise these two areas to give yourself the best fighting chance of alleviating poverty, or keeping it at bay. After ensuring we have enough income for subsistence, and can feed ourselves and our families, girding our health and education prospects on the order of 15% of gross income is essential for whatever our income levels.
Summary:
For OECD country readers, affirm your annual commitment to give 0.7% of your gross income as aid.
For readers in countries off-track:
contact your government, requesting they increase public spending on health and education to 15% of GDP
spend 15% of your gross income on health and education
For high-income and all OECD DAC countries: International concessional public finance, including official development assistance (% of GNI)
Readers must assume I have a lot of gall to put this indicator to page, such has been its ubiquity heretofore. Still, it'd be remiss to list all indicators except one, even if readers may have grown tired of the point it's been attempting to make throughout the tapestry of other indicators.
For clarification, the measure is a percentage of gross national income, rather than total aid. For example, the US is the biggest aid giver in total dollars, but as a proportion of gross national income, this amounts to one of the worst percentages, at 0.18% of GNI as of 2021.
Prior to the setbacks of COVID-19, the OECD estimated the annual financing shortfall to achieve the SDGs amounted to $2.5 trillion. Within a 2020 gross world product (GWP) of $85 trillion, this is only 3%. You already know 0.7% of GNI of the OECD DAC members will end extreme poverty. Even now, after the devastation of COVID-19 increased the annual funding shortfall to $4.2 billion, the global economy has this money lying around. The equivalent of a quarter of the GWP in savings is at the world's disposal, $22 trillion worth - enough to achieve the SDGs fivefold.
Of note, the optimum for this indicator is 1% of GNI, rather than 0.7%, justified as an average of the 5 best performers. I’ve encouraged 0.7% throughout, because this has been affirmed on repeated occasions in international agreements. However, to achieve this indicator, please round up to a full 1% of your gross income.
Summary: For high-income country readers, give 1% of your gross income as aid.
Other countries: Government revenue excluding grants (% of GDP)
This indicator focuses on the means of developing countries to raise revenue, which could then be spent on poverty alleviation, financing progress toward the respective Goals.
This revenue originates from levying taxes, fines, fees, rents from resources, and property and sales taxes, aiming by 2030 for a government revenue equal to 40% of GDP. <a href="https://data.worldbank


 United States
