


SDG #9 - Industry, Innovation and Infrastructure
Description
sqs-block-image-figure
intrinsic
">
</figure>
<figure class="
sqs-block-image-figure
intrinsic
">
<figcaption class="image-caption-wrapper">
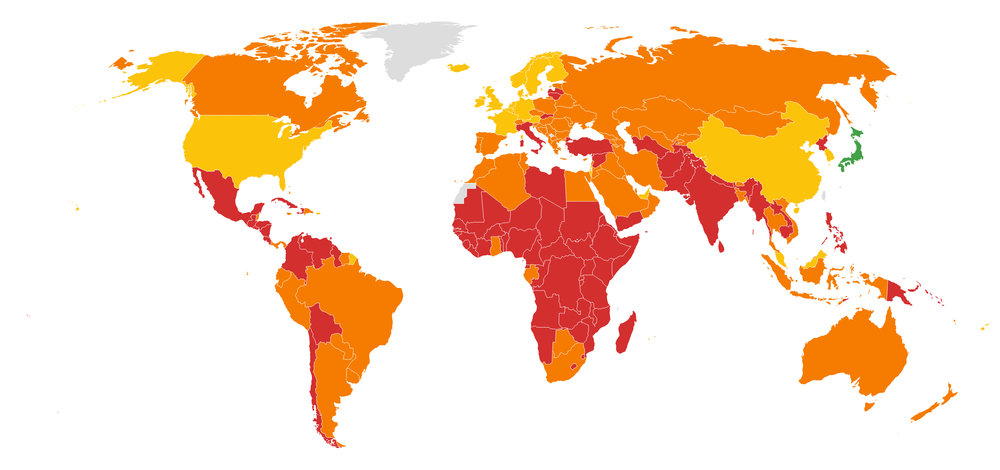
Dashboard map for 2022 SDG Index Goal #9 ratings. Data source: sdgindex.org
</figcaption>
</figure>
Population using the internet (%)
The definition of this indicator is using the internet within the last three months, whether from a fixed or mobile network, aiming for 100% of the world population to use the internet by 2030.
Since the era of COVID-19, life has accelerated into the digital sphere. The path out of such a setback as the pandemic is to orient society and the economy around a green and digital transformation.
As of 2021, an estimated 4.9 billion people, or 63% of the world population, are using the internet, a growth from 3 billion, or 41%, in 2015. Of the internet users in 2021, 92% accessed from a mobile device, which is encouraging for rural areas in developing countries. But as we’ll see from the Index scores, the developed countries have a clear lead over developing countries. China has the most internet users, totalling 1.01 billion, or 71% of the population, followed by India with 833 million, or 61% of the population (thus scoring red for this indicator), then the US with 312 million and 95%.
The common thread of red scores in the 2022 scores are LDCs, small island developing states, states in conflict or post-conflict, and landlocked developing countries. A couple of middle-income countries are ciphers with red scores i.e., Philippines and some Central American countries. Reasons why each of these countries have such low internet usage include:
cost
availability of service
lack of ICT infrastructure
censorship
predominance of English on the internet
dearth of uses for the internet in the local tongue
There’s little question in 2022, to be without the internet in the developed world feels on par with the electricity going out - life halts. In developing country situations, foreign aid is needed to broach the digital divide. This is the path to achieving this indicator’s long-term objective of the whole world population using the internet.
Summary:
For OECD country readers, affirm your annual commitment to give 0.7% of your gross income as aid, aiming for all to have internet access by 2030.
For readers in countries off-track, use the internet, where available and affordable.
Mobile broadband subscriptions (per 100 population)
This indicator focuses on subscriptions to mobile networks with an added data plan offering internet access, aiming for 100 mobile broadband subscriptions per population of 100. Furthermore, it requires the connection to be running at broadband speed (250 kilobits per second or greater), whether used on a mobile phone, tablet, or any other device.
Many readers will have memories of an era before broadband was available, or when mobile devices were akin to what's now known as feature phones, with data and internet access, but without broadband capabilities. Now, using our phone as a modem, we're untethered. Mobile phone subscriptions already outnumber the world population, estimated at around 6 billion as of 2020.
The picture painted by the 2022 scores for this indicator tell a similar story to the indicator before, with similar countries represented in red - as such, the recommendations are similar. The foreign aid of readers must aid the shortfall of financing to develop cellular network infrastructure. Bringing people out of poverty allows them to afford whatever cost a subscription might entail, and with it the wonders of global connectivity, as well as some of the drawbacks, as we all experience in different guises of life online. But for the LDCs, a mobile subscription can mean remote access to education, health, and myriad social services, as well as e-commerce. It unleashes the unlimited possibilities the internet affords all those who use it. To connect at broadband speeds, on a mobile device, also mitigates the need for fixed landlines, as the installation of electrical or telephone lines in remote spaces is still non-existent in some areas.
Thus, for our DAC member country readers, we already know the recommendation on behalf of our developing counterparts. For those in countries off-track for this indicator with the means to afford a mobile broadband subscription, it’s as simple as subscribing to the mobile network operator of your choice.
Summary:
For OECD country readers, affirm your annual commitment to give 0.7% of your gross income as aid, aiming for mobile subscriptions for all by 2030.
For readers in countries off-track, get a mobile broadband subscription.
Logistics Performance Index: Quality of trade and transport-related infrastructure (worst 1-5 best)
This indicator measures a country's quality of trade logistics and transport infrastructure e.g., ports, roads, railroads and IT. 1 is the worst score and 5 the best, aiming for a 2030 score of 3.8. To give an idea of what 3.8 looks like, using 2018 Logistics Performance Index scores, the US scores 4.05 and China 3.75. Germany is the top-ranked, with a score of 4.20. The world Logistics Performance Index score is 2.72 in 2018.
Logistical systems like roads, ports and railroads need large investments of capital, often on the scale of billions of dollars. There’s almost nothing an individual can do to affect change at their level for this indicator. It’s good to know where the opportunities for improvements lie and where the global logistical blind spots are, but there’s little you can do to help achieve this indicator.
The Times Higher Education Universities Ranking: Average score of top 3 universities (worst 0-100 best)
This average of the top three universities in a country is from two lists of the top universities in the world. The 2030 goal is to reach an average score of 50. Most countries are close to on-track for this indicator, which is of benefit, as it'd be unfair to ask students, or prospective students, to increase the quality of the top 3 institutions in their country. Thus, you can aim for your home country to have an average score of 50 for this indicator by 2030, but it’s beyond the scope of the individual to affect this change.
Articles published in academic journals (per 1,000 population)
This indicator counts the articles cited in journals in the past three years, attributing the country based on the location of the institution of the work. The aim by 2030 is for 1.2 scientific and technical journal articles per 1,000 population.
This requires the infrastructure of a country’s educational system to foster students from early development, with a good foundation in STEM subjects into tertiary education. This allows for higher education at a post-graduate level, allowing for publication in journal articles.
We can only hope to ask readers in countries off-track to consider the commitment to join the ranks to publish scientific articles. Another more lateral solution could be academics from OECD countries migrating their careers, contributing to the stock of expertise and contribution of journal articles. Then, knowledge will accrue in developing countries, much as doctors from the West bring their expertise to assist in developed cou


 United States
