


Visualizing the Cost of the U.S. Government Shutdown
Description
Visualizing the Cost of the U.S. Government Shutdown
See visuals like this from many other data creators on our Voronoi app. Download it for free on iOS or Android and discover incredible data-driven charts from a variety of trusted sources.
Key Takeaways
- Roughly 1.4 million federal workers were impacted by the record U.S. government shutdown, with 730,000 working without pay and 670,000 furloughed.
- Total delayed federal government spending was estimated to be $54 billion.
The record-long U.S. government shutdown resulted in billions in losses to the economy.
Over a million federal workers went without pay for more than six weeks, limiting their spending capacity. Meanwhile, about $2 billion in food stamp spending was delayed over the six-week period, affecting 40 million people.
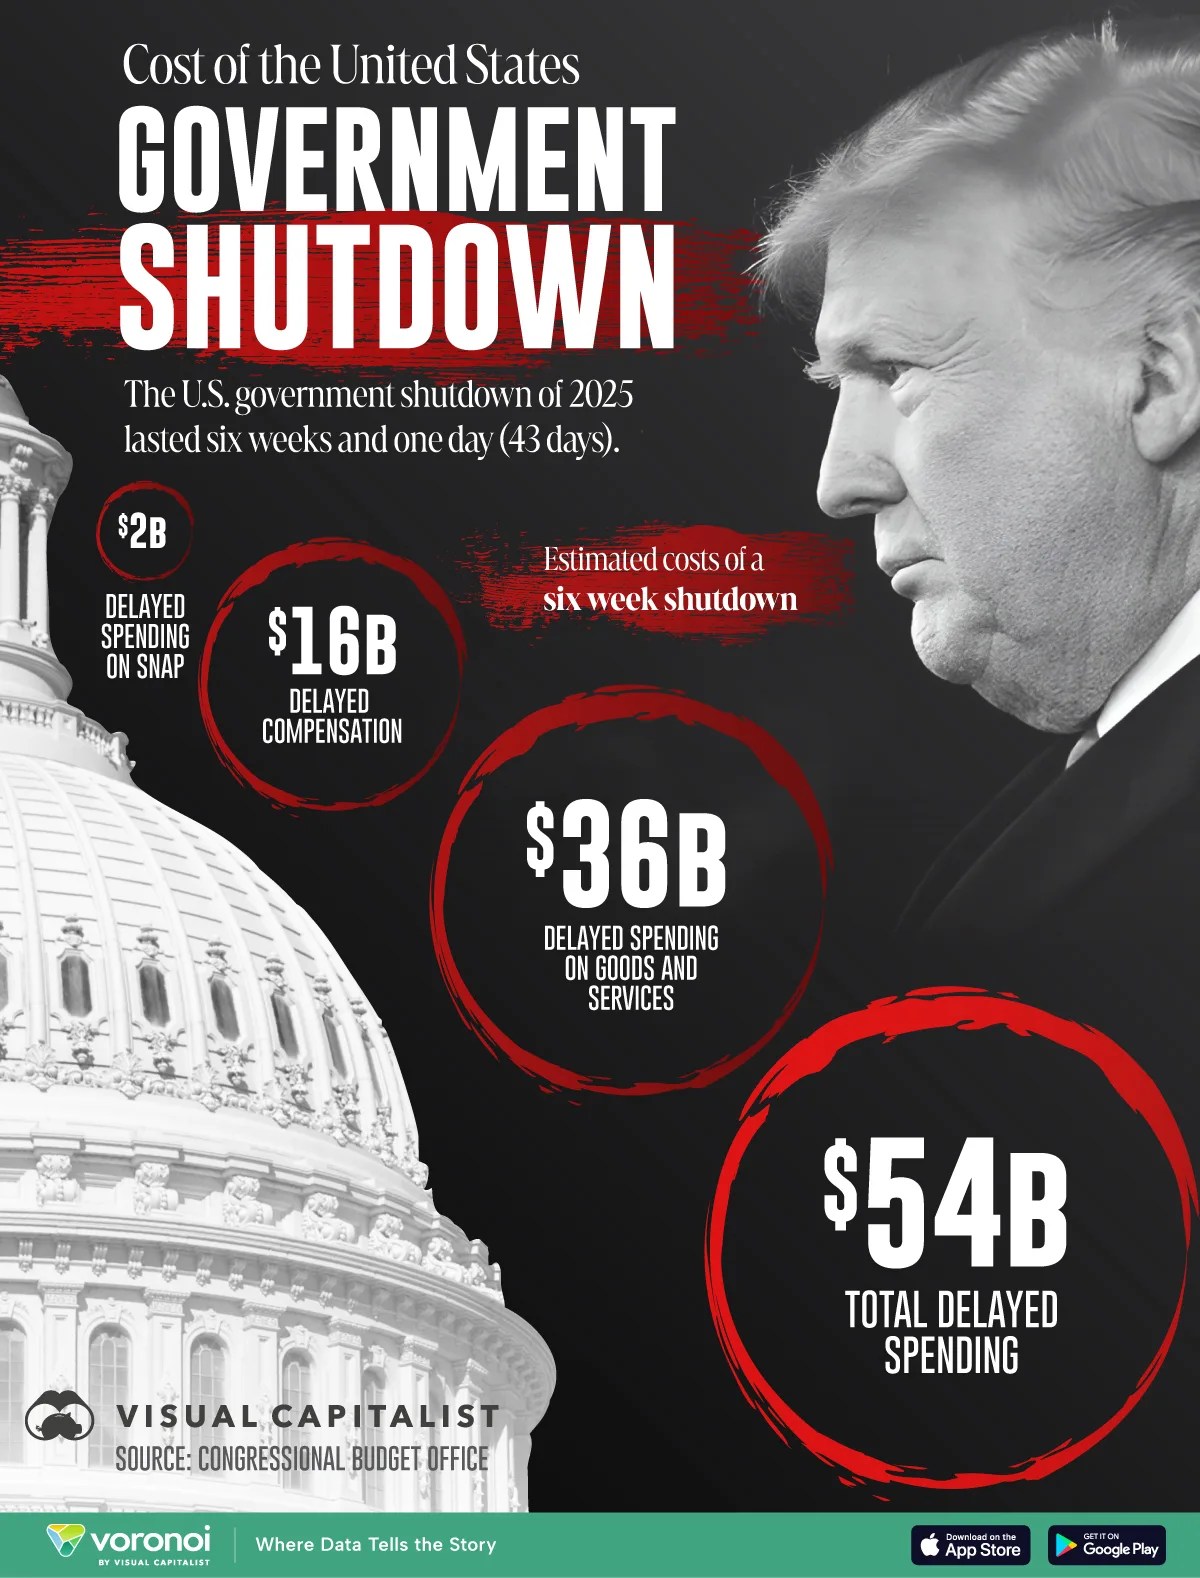
This graphic shows the estimated cost of the U.S. government shutdown, based on analysis from the Congressional Budget Office.
The Government Shutdown’s $54 Billion Freeze
Below, we show the financial impact of delayed federal spending by category:
| Category | Six Week Shutdown Estimates |
|---|---|
| Delayed Spending on Goods and Services | $36B |
| Delayed Compensation | $16B |
| Delayed Spending on SNAP | $2B |
| Total Delayed Spending | $54B |
As we can see, delayed compensation was estimated to reach $16 billion over a six-week period.
In total, 730,000 federal employees were working without pay, while 670,000 were furloughed. Many air traffic controllers looked for other work during the shutdown, an industry already facing a shortage of 3,903 fully certified workers prior to the shutdown.
Delayed spending on goods and services totaled $36 billion, the largest category overall. For instance, the shutdown forced the Small Business Administration to halt $170 million in federal loan guarantees per day, impacting at least 8,300 small businesses.
Given these disruptions, it is estimated that the shutdown will shave off $28 billion from real GDP in the fourth quarter of 2025. For the travel industry alone, spending fell by an estimated $5 billion.
Learn More on the Voronoi App 
To learn more about this topic, check out this graphic on America’s federal workforce.


 United States
