DiscoverThe Lead-Lag ReportForget Tech: The Real AI Trade Might Be Power, Pipes, and Payouts
Forget Tech: The Real AI Trade Might Be Power, Pipes, and Payouts

Forget Tech: The Real AI Trade Might Be Power, Pipes, and Payouts

Update: 2025-10-17
Share

Description

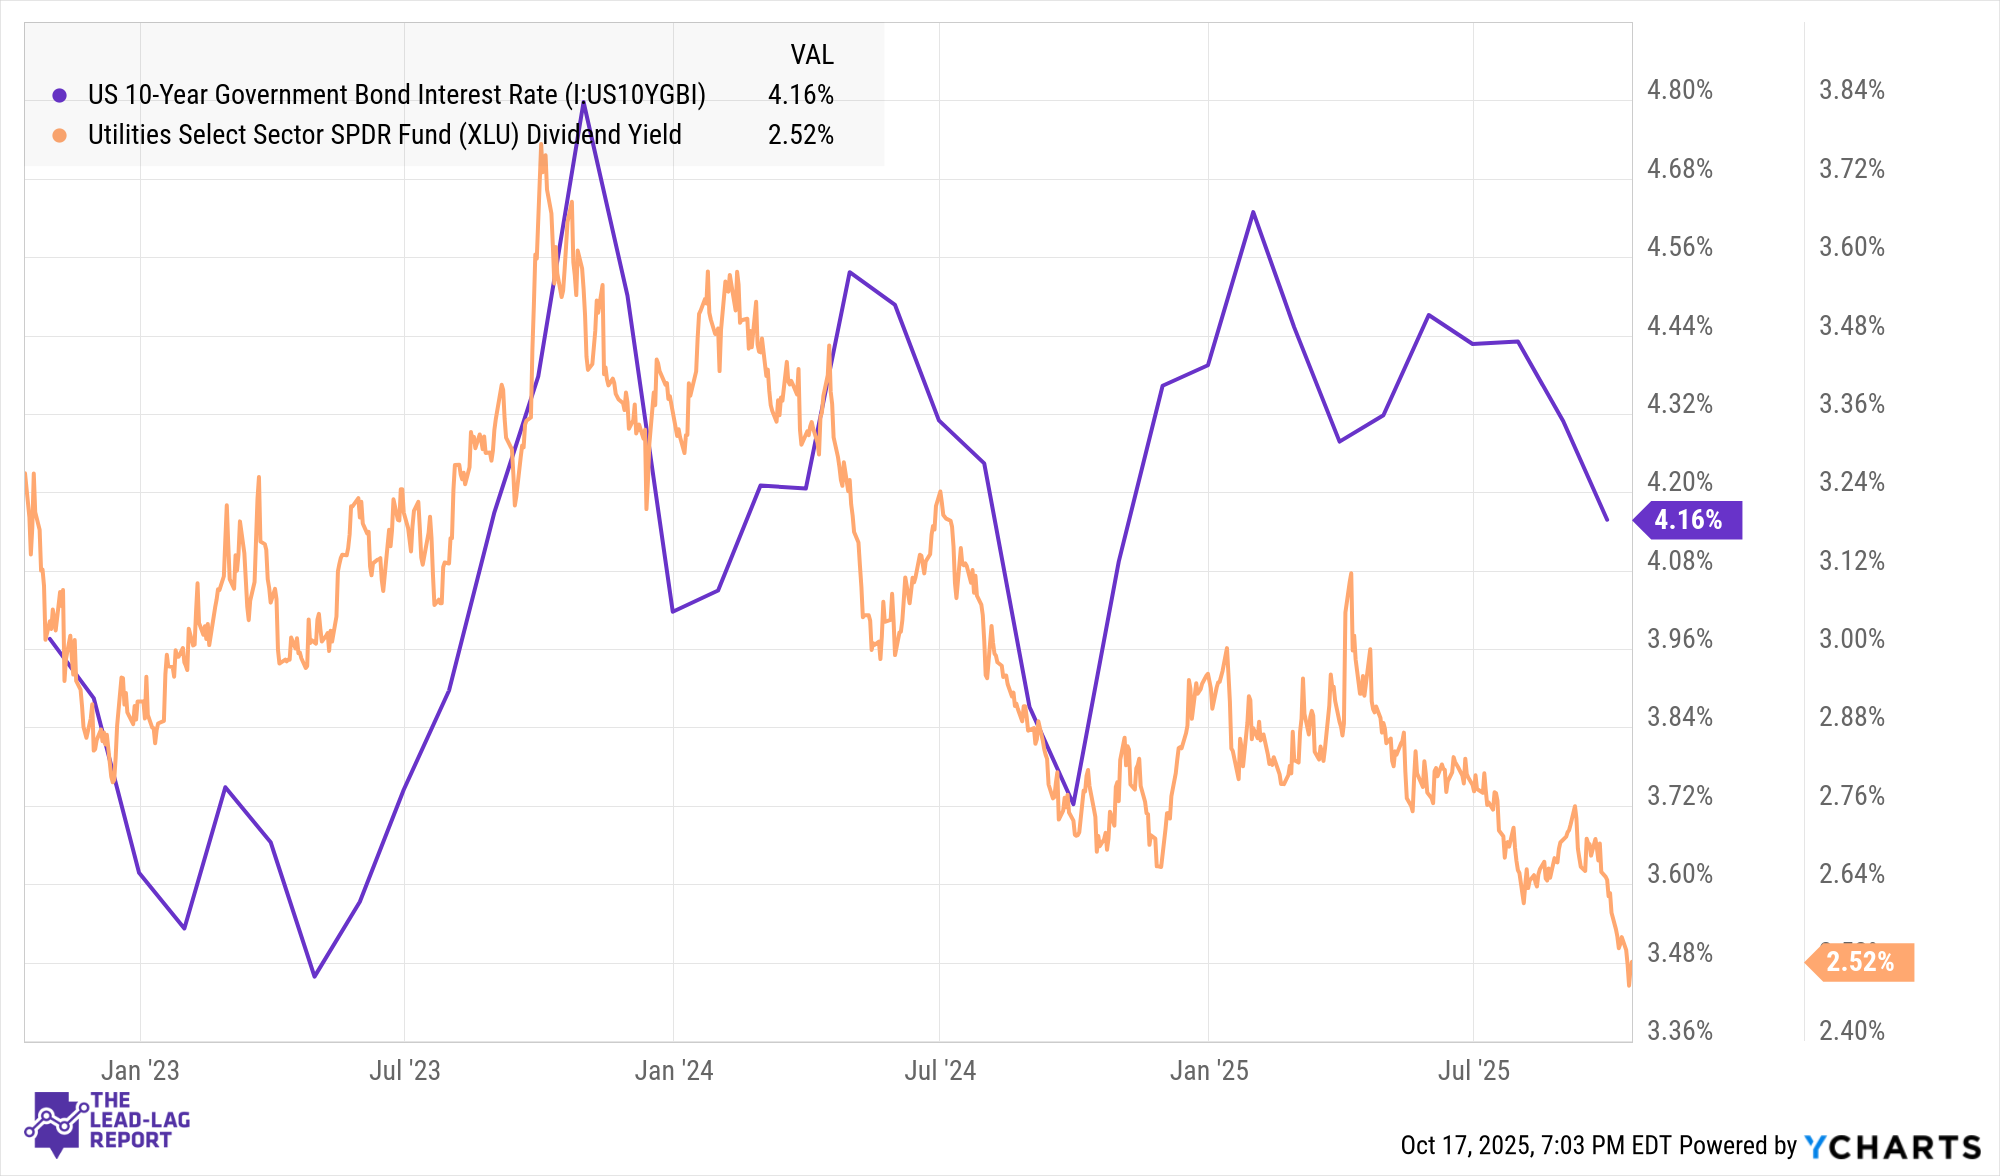
Investors seeking income face a challenge: the S&P 500 yields below 2%, offering limited cash flow versus historical norms¹. Early optimism around a potential Federal Reserve pivot drove yields lower and lifted defensive sectors. As those expectations moderated, Treasury yields rebounded, cooling speculative excesses. Utilities—historically interest-rate sensitive—may benefit if the Fed continues to lean towards easing, as falling yields enhance dividend appeal and lower borrowing costs. Whether rates fall through disinflation or slowdown, utilities tend to outperform in uncertain environments, making income-focused strategies like UTG increasingly relevant.

<figure>
<source type="image/webp" />
<svg class="lucide lucide-refresh-cw" fill="none" height="20" stroke="currentColor" stroke-linecap="round" stroke-linejoin="round" stroke-width="2" viewBox="0 0 24 24" width="20" xmlns="http://www.w3.org/2000/svg"><path d="M3 12a9 9 0 0 1 9-9 9.75 9.75 0 0 1 6.74 2.74L21 8"></path><path d="M21 3v5h-5"></path><path d="M21 12a9 9 0 0 1-9 9 9.75 9.75 0 0 1-6.74-2.74L3 16"></path><path d="M8 16H3v5"></path></svg>
<svg class="lucide lucide-maximize2 lucide-maximize-2" fill="none" height="20" stroke="currentColor" stroke-linecap="round" stroke-linejoin="round" stroke-width="2" viewBox="0 0 24 24" width="20" xmlns="http://www.w3.org/2000/svg"><polyline points="15 3 21 3 21 9"></polyline><polyline points="9 21 3 21 3 15"></polyline><line x1="21" x2="14" y1="3" y2="10"></line><line x1="3" x2="10" y1="21" y2="14"></line></svg>
</figure>

Utilities Sector Outlook

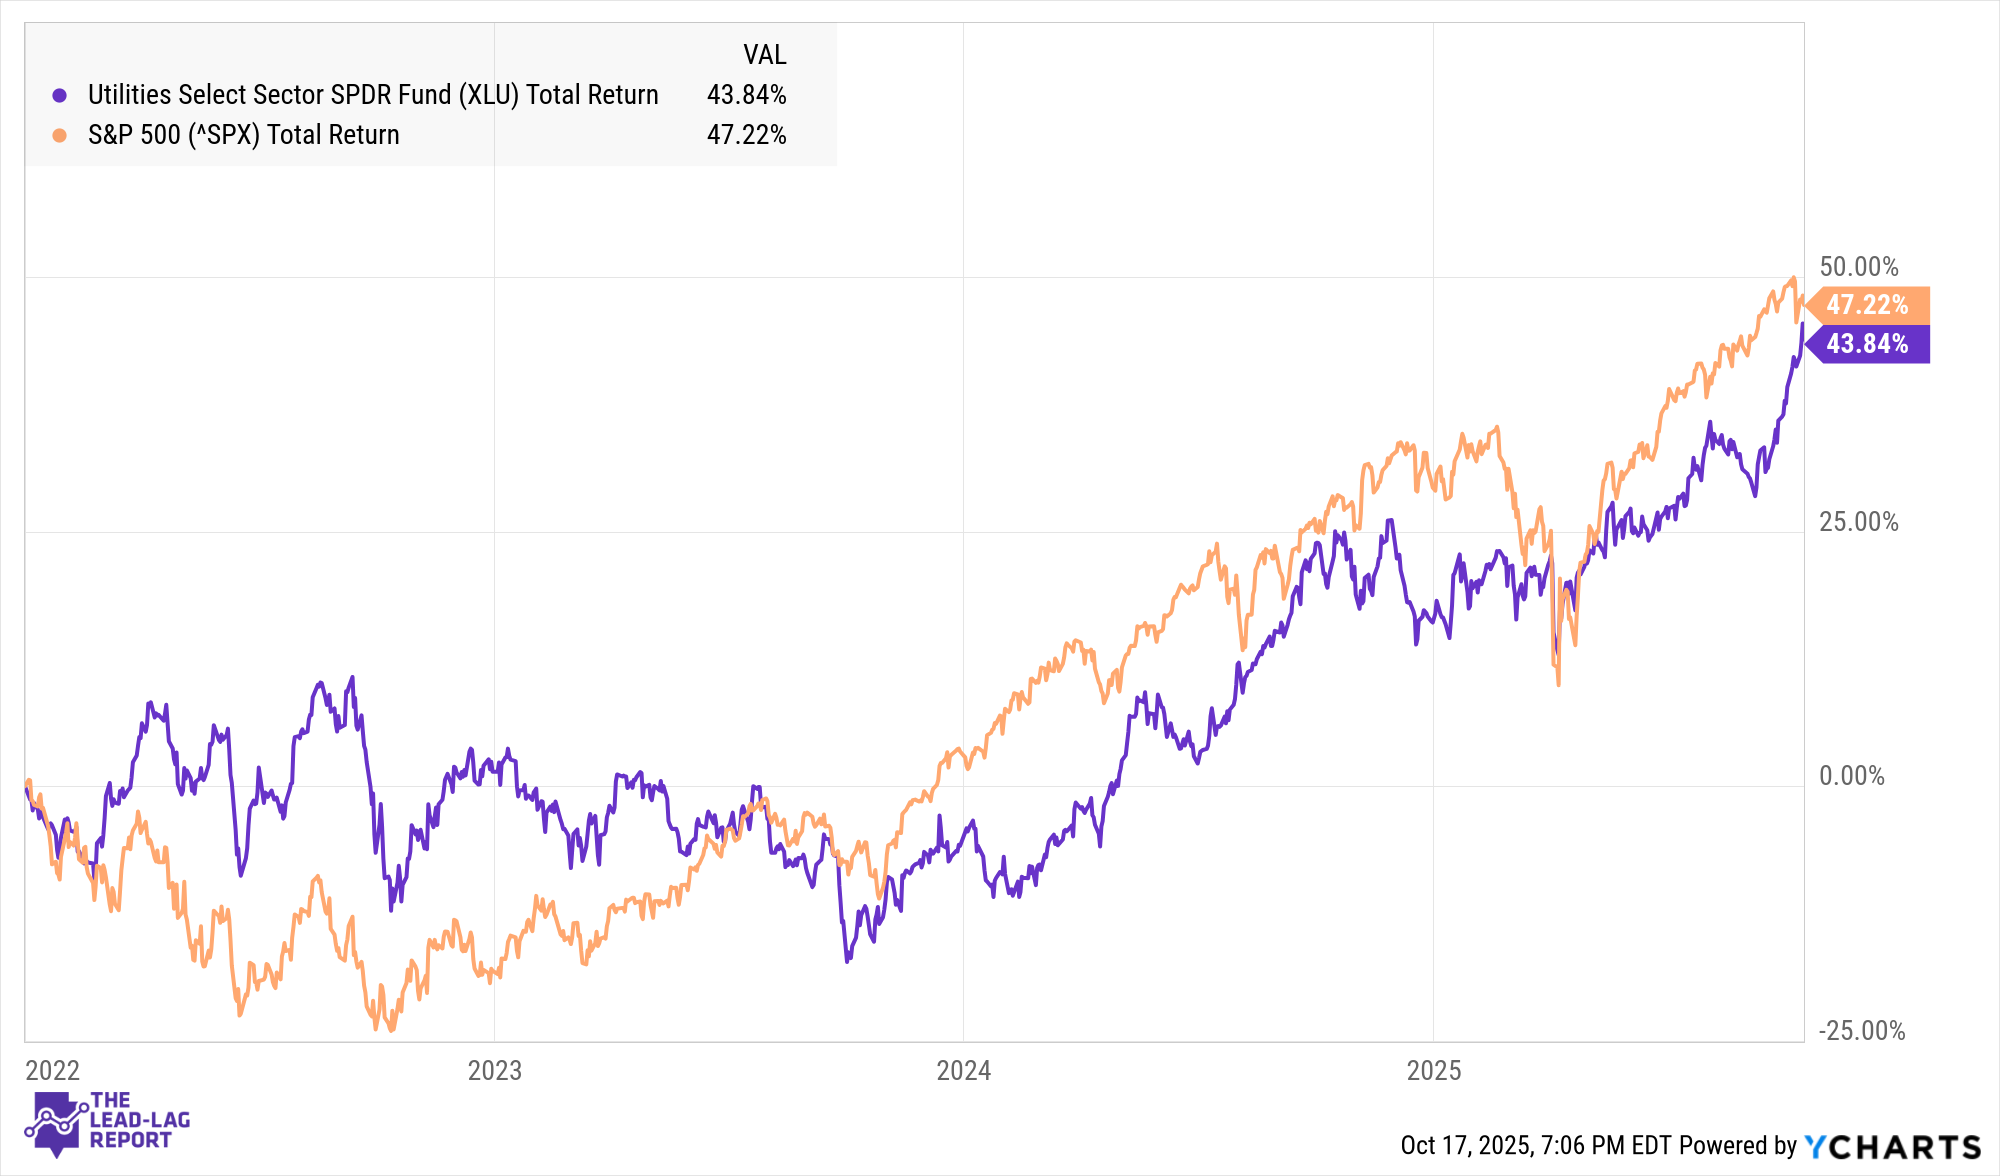
Utilities were the S&P 500’s worst performer in 2023², lagging far behind growth and tech. Their underperformance left valuations compelling and poised for mean reversion. As economic momentum cools and inflation fades, investors often rotate toward stable, regulated businesses with consistent cash flows. Utilities’ resilience during downturns—driven by steady electricity and water demand—supports this thesis. If inflation turns to disinflation, utilities’ relative attractiveness improves further through yield spread expansion. While absolute returns may stay moderate, the sector’s fundamentals and dividend strength create a supportive backdrop for funds emphasizing defense and income

<figure>
<source type="image/webp" />
<svg class="lucide lucide-refresh-cw" fill="none" height="20" stroke="currentColor" stroke-linecap="round" stroke-linejoin="round" stroke-width="2" viewBox="0 0 24 24" width="20" xmlns="http://www.w3.org/2000/svg"><path d="M3 12a9 9 0 0 1 9-9 9.75 9.75 0 0 1 6.74 2.74L21 8"></path><path d="M21 3v5h-5"></path><path d="M21 12a9 9 0 0 1-9 9 9.75 9.75 0 0 1-6.74-2.74L3 16"></path><path d="M8 16H3v5"></path></svg>
<svg class="lucide lucide-maximize2 lucide-maximize-2" fill="none" height="20" stroke="currentColor" stroke-linecap="round" stroke-linejoin="round" stroke-width="2" viewBox="0 0 24 24" width="20" xmlns="http://www.w3.org/2000/svg"><polyline points="15 3 21 3 21 9"></polyline><polyline points="9 21 3 21 3 15"></polyline><line x1="21" x2="14" y1="3" y2="10"></line><line x1="3" x2="10" y1="21" y2="14"></line></svg>
</figure>

Fund Profile and Strategy

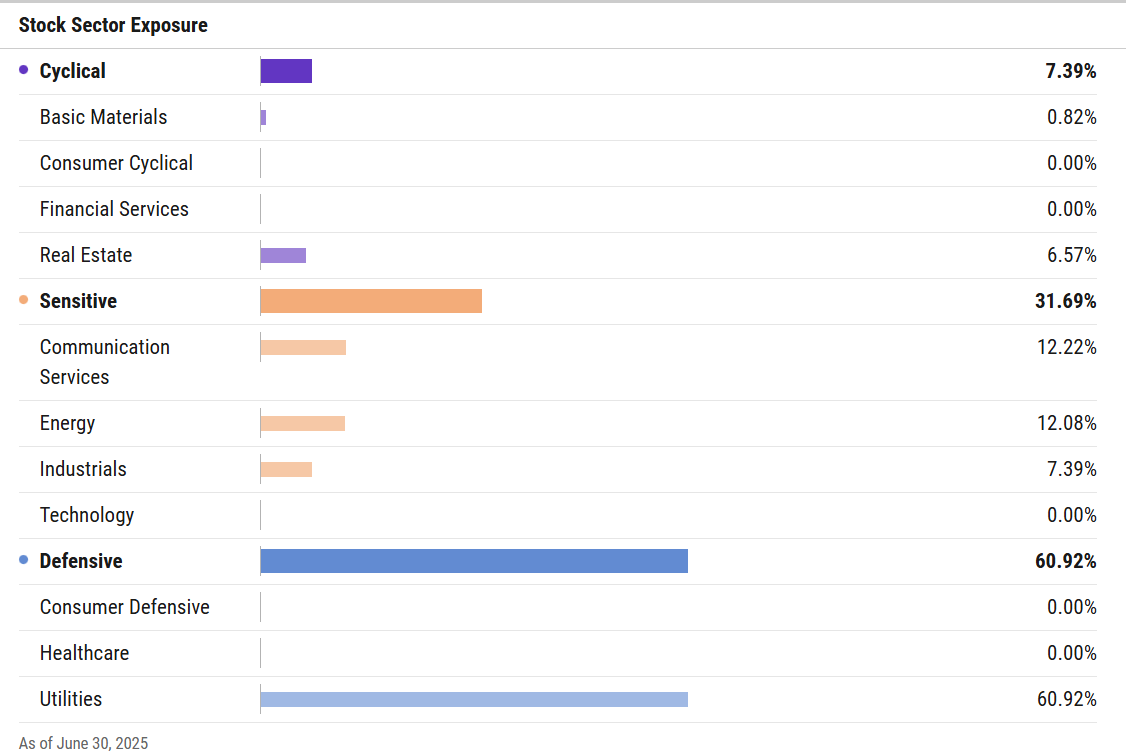
The Reaves Utility Income Fund (UTG), launched in 2004, seeks high after-tax income and total return through investments in utility-related equities. The fund primarily holds dividend-paying common stocks, with moderate leverage of roughly 20–25% to enhance yield. UTG may invest up to 20% of assets beyond core utilities³—covering telecoms, infrastructure, and energy pipeline companies. This flexibility broadens its scope across essential-service industries. The result is exposure to electric, gas, and water utilities alongside communications and infrastructure names—creating a diversified, income-oriented mix.

<figure>
<source type="image/webp" />
<svg class="lucide lucide-refresh-cw" fill="none" height="20" stroke="currentColor" stroke-linecap="round" stroke-linejoin="round" stroke-width="2" viewBox="0 0 24 24" width="20" xmlns="http://www.w3.org/2000/svg"><path d="M3 12a9 9 0 0 1 9-9 9.75 9.75 0 0 1 6.74 2.74L21 8"></path><path d="M21 3v5h-5"></path><path d="M21 12a9 9 0 0 1-9 9 9.75 9.75 0 0 1-6.74-2.74L3 16"></path><path d="M8 16H3v5"></path></svg>
<svg class="lucide lucide-maximize2 lucide-maximize-2" fill="none" height="20" stroke="currentColor" stroke-linecap="round" stroke-linejoin="round" stroke-width="2" viewBox="0 0 24 24" width="20" xmlns="http://www.w3.org/2000/svg"><polyline points="15 3 21 3 21 9"></polyline><polyline points="9 21 3 21 3 15"></polyline><line x1="21" x2="14" y1="3" y2="10"></line><line x1="3" x2="10" y1="21" y2="14"></line></svg>
</figure>

Performance and Risk Profile

Since inception in 2004, UTG has delivered roughly +851% in total return. Most of its long-term return stems from reinvested distributions. Despite leverage, volatility has remained modest, and the fund’s NAV and price have moved largely in tandem. While UTG occasionally trails a low-cost utility index, its risk-adjusted performance remains competitive. During market crises, leverage has amplified drawdowns (2008, 2020), yet its recovery profile and steady payout offset that cyclicality.


Read more

Comments 
In Channel
loading
00:00
00:00
x

0.5x

0.8x

1.0x

1.25x

1.5x

2.0x

3.0x

Sleep Timer

Off

End of Episode

5 Minutes

10 Minutes

15 Minutes

30 Minutes

45 Minutes

60 Minutes

120 Minutes

Forget Tech: The Real AI Trade Might Be Power, Pipes, and Payouts

Forget Tech: The Real AI Trade Might Be Power, Pipes, and Payouts

Michael A. Gayed, CFA