Late-Year Seasonality: November–December Strength
Description
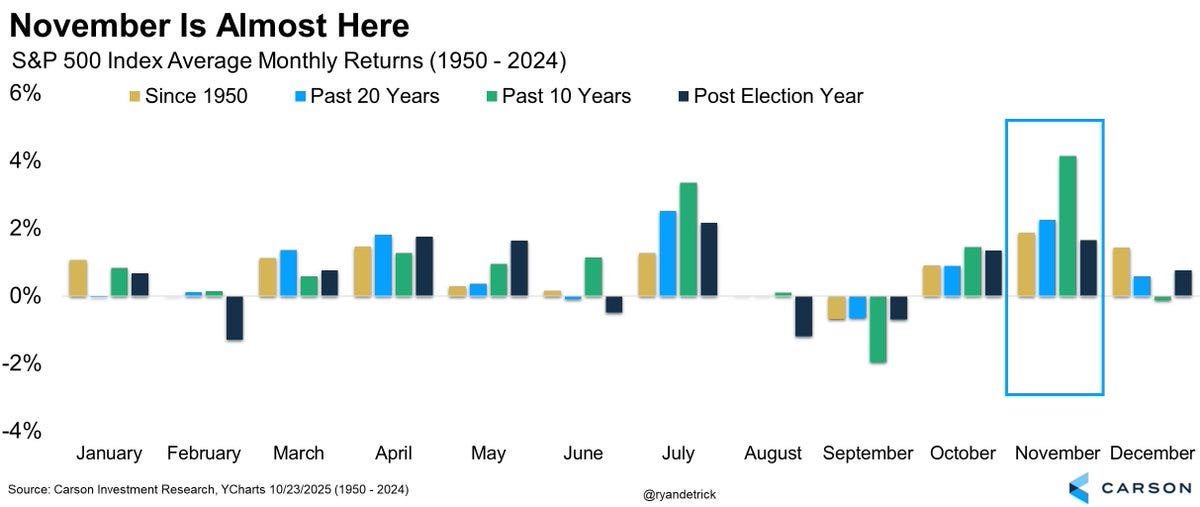
Seasonality often gets dismissed as folklore. Yet history keeps proving that the final stretch of the year—November and December—has been a sweet spot for equity investors. Over the past 50 years, the S&P 500 has rallied in November roughly 73 percent of the time, averaging gains of around 2 percent¹. December follows closely: since 1950, it has been the second-best month, with an average gain of 1.6 percent and nearly three-quarters of Decembers ending higher²³.
This pattern has inspired the familiar “Santa Claus Rally” narrative. Charts of long-term monthly returns consistently show November and December towering over other months. Even when markets have stumbled earlier in the year, this late-year stretch has frequently delivered a recovery as optimism builds around earnings, holiday spending, and the coming year’s outlook.
Consistency Over Decades
The reliability of this effect stands out. In a half-century sample, about three out of four Novembers or Decembers end positive¹³. By contrast, September’s historical win rate is barely above 40 percent. Staying invested through the holidays has simply paid off more often than not.
The gains are not driven by a few outliers either. Yardeni Research shows that since 1928, December produced 70 positive years versus 27 negative, and November 60 versus 37. That breadth of positive outcomes underlines how durable the pattern has been.
Average late-year returns reinforce the point. November’s +2 percent and December’s +1.5 percent returns²³ far exceed the long-term monthly average near +0.7 percent. These numbers have held across multiple cycles—from inflationary 1970s recoveries to the post-pandemic bull market.
Year-to-Year Examples
Recent years illustrate how persistent the effect remains. In 2023, the S&P 500 surged roughly 9 percent in November and another 4 percent in December as recession fears faded. In 2024, November again posted a gain near 5.7 percent⁴, far exceeding its long-term average.
Even difficult years haven’t fully broken the pattern. In 2022, while equities finished down sharply for the year, December still managed a modest rebound of roughly +2.5 percent after a weak September. Looking across the past two decades, at least one of those two months—November or December—has ranked among the top performers in most years.


