DiscoverThe Lead-Lag ReportWhy Warren Buffett Is Sitting on Record Cash — and What That Says About the Market
Why Warren Buffett Is Sitting on Record Cash — and What That Says About the Market

Why Warren Buffett Is Sitting on Record Cash — and What That Says About the Market

Update: 2025-11-01
Share

Description

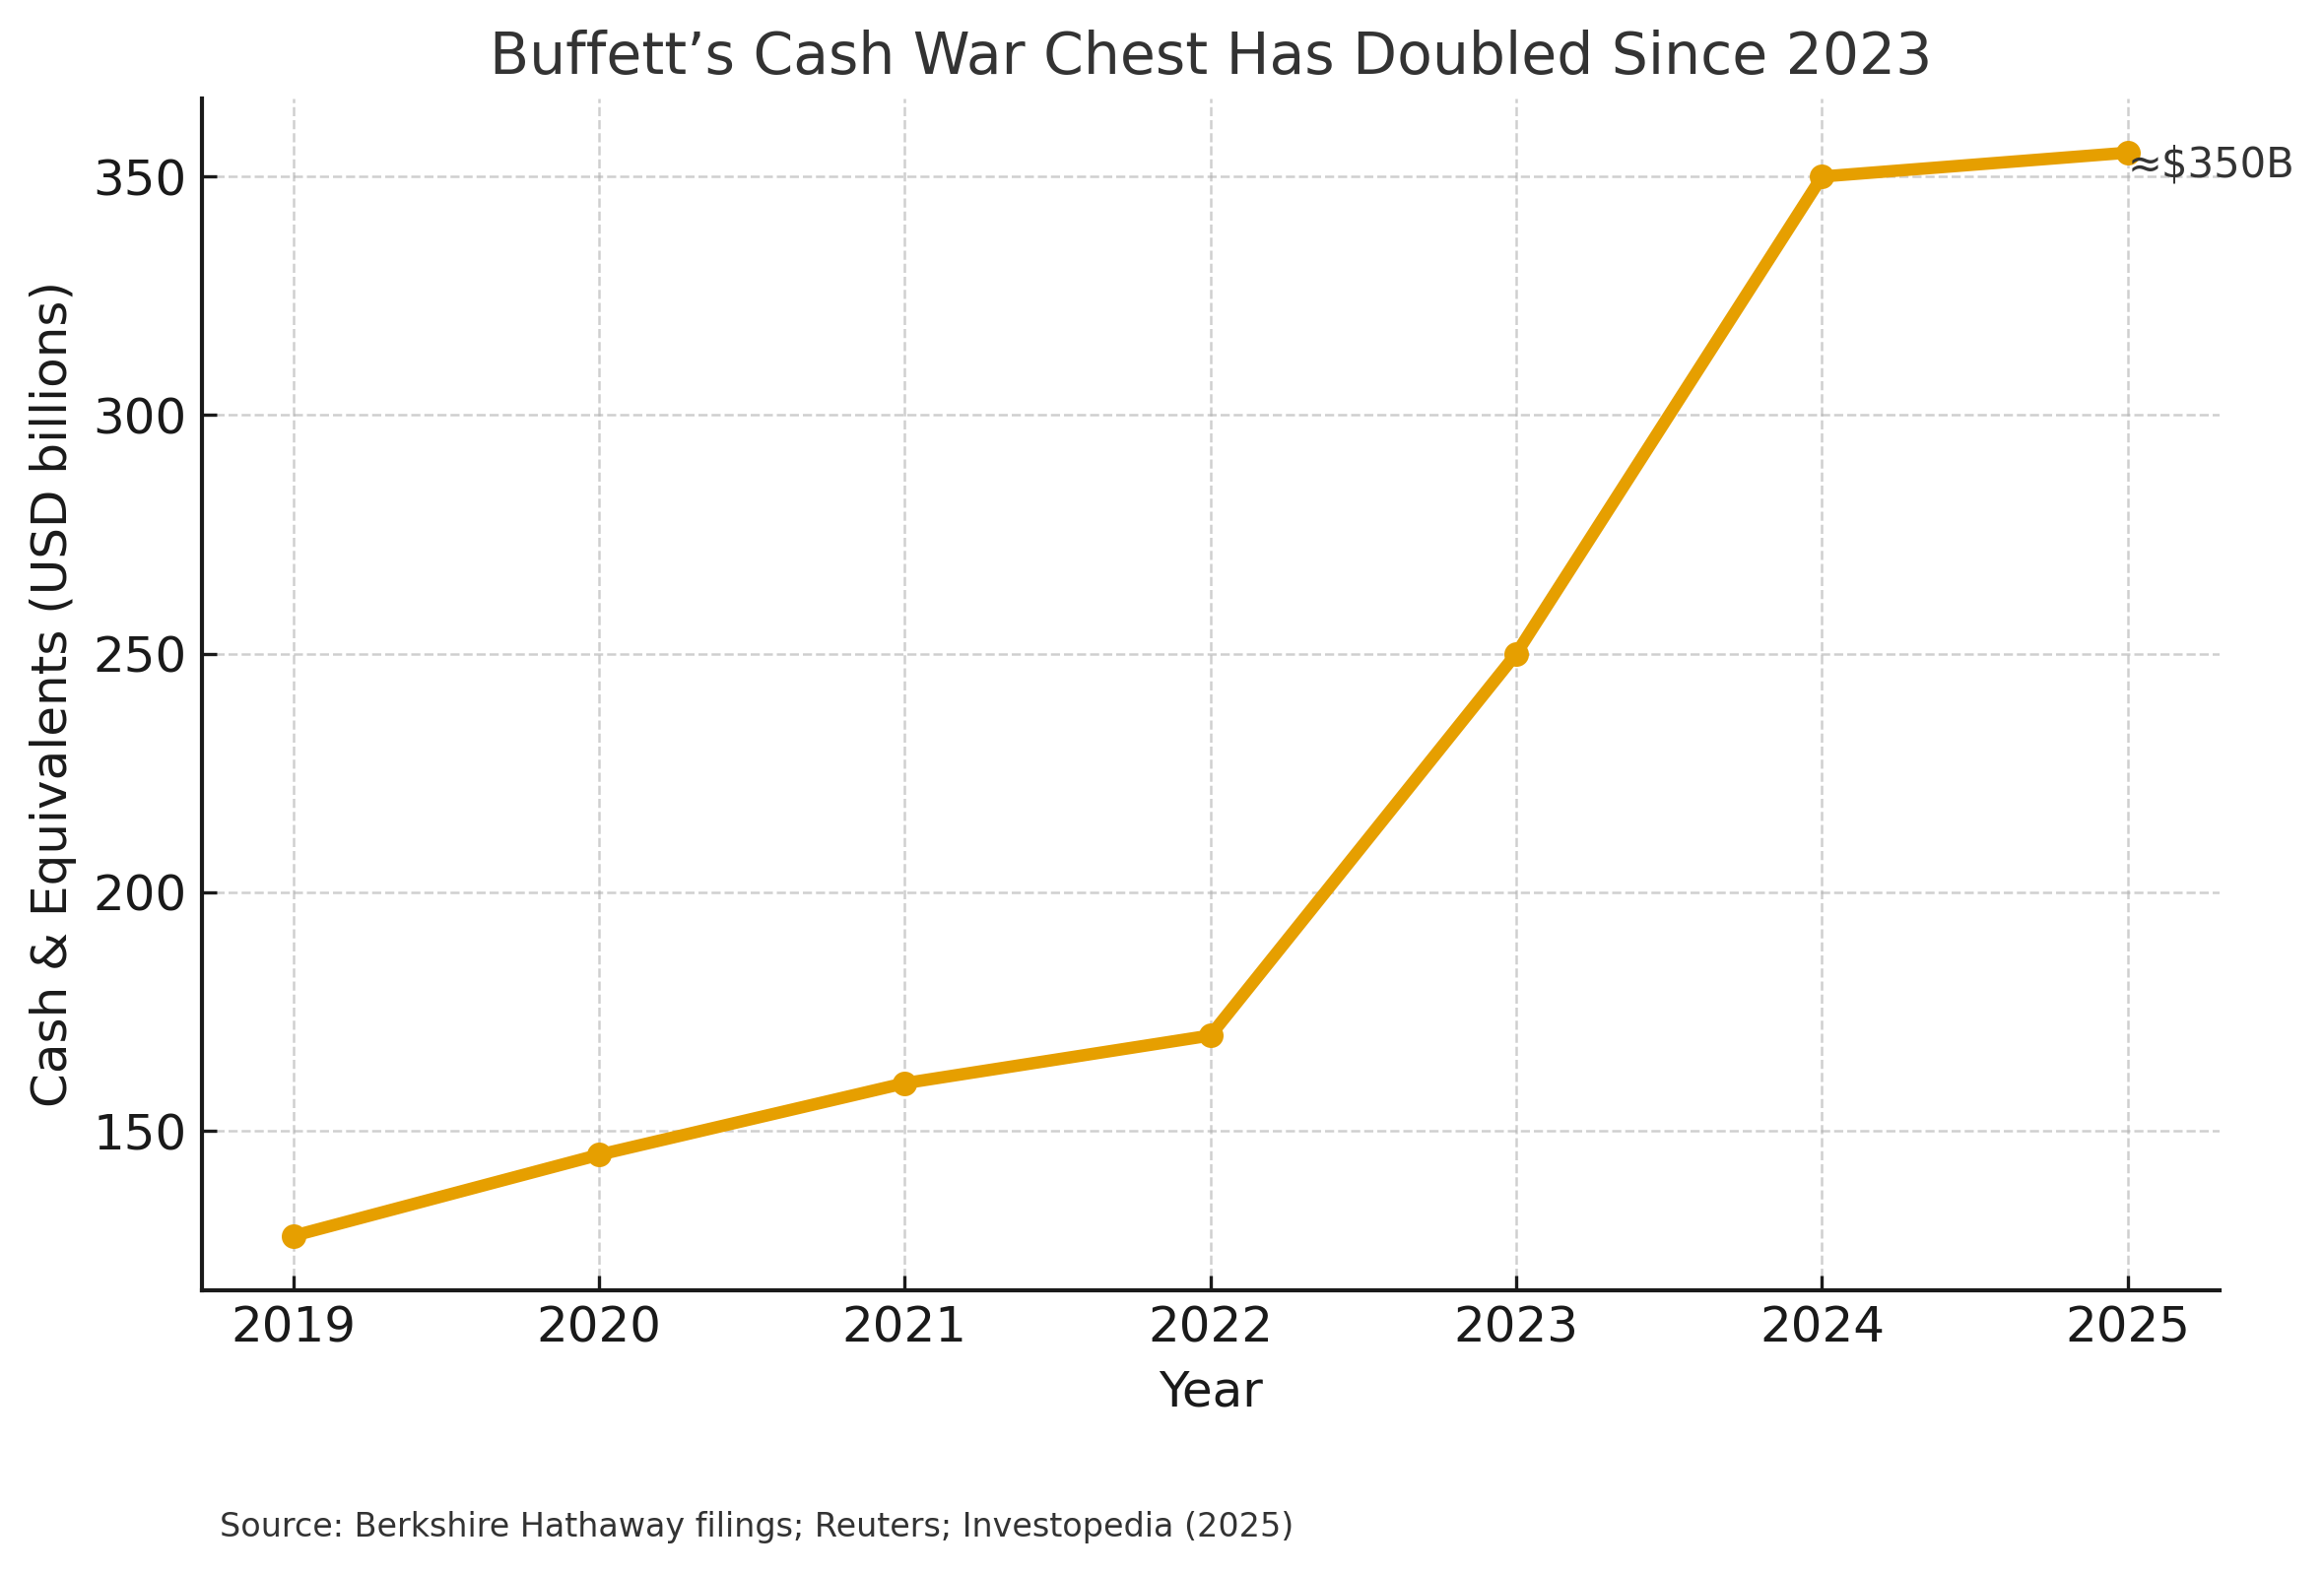
When Warren Buffett—famed for spotting undervalued stocks—is reluctant to buy, investors take notice. His firm, Berkshire Hathaway, is holding nearly $350 billion in cash and short-term Treasuries—the largest hoard ever amassed by a public company, even exceeding the combined liquid reserves of Apple, Microsoft, Alphabet, Amazon, and Nvidia¹. This war chest has doubled in just over a year², built as Berkshire sold far more stock than it bought. Why is the “Oracle of Omaha” waiting on the sidelines—and what might that signal about today’s market?

<figure>
<source type="image/webp" />
<svg class="lucide lucide-refresh-cw" fill="none" height="20" stroke="currentColor" stroke-linecap="round" stroke-linejoin="round" stroke-width="2" viewBox="0 0 24 24" width="20" xmlns="http://www.w3.org/2000/svg"><path d="M3 12a9 9 0 0 1 9-9 9.75 9.75 0 0 1 6.74 2.74L21 8"></path><path d="M21 3v5h-5"></path><path d="M21 12a9 9 0 0 1-9 9 9.75 9.75 0 0 1-6.74-2.74L3 16"></path><path d="M8 16H3v5"></path></svg>
<svg class="lucide lucide-maximize2 lucide-maximize-2" fill="none" height="20" stroke="currentColor" stroke-linecap="round" stroke-linejoin="round" stroke-width="2" viewBox="0 0 24 24" width="20" xmlns="http://www.w3.org/2000/svg"><polyline points="15 3 21 3 21 9"></polyline><polyline points="9 21 3 21 3 15"></polyline><line x1="21" x2="14" y1="3" y2="10"></line><line x1="3" x2="10" y1="21" y2="14"></line></svg>
</figure>

Buffett’s Record Cash Pile

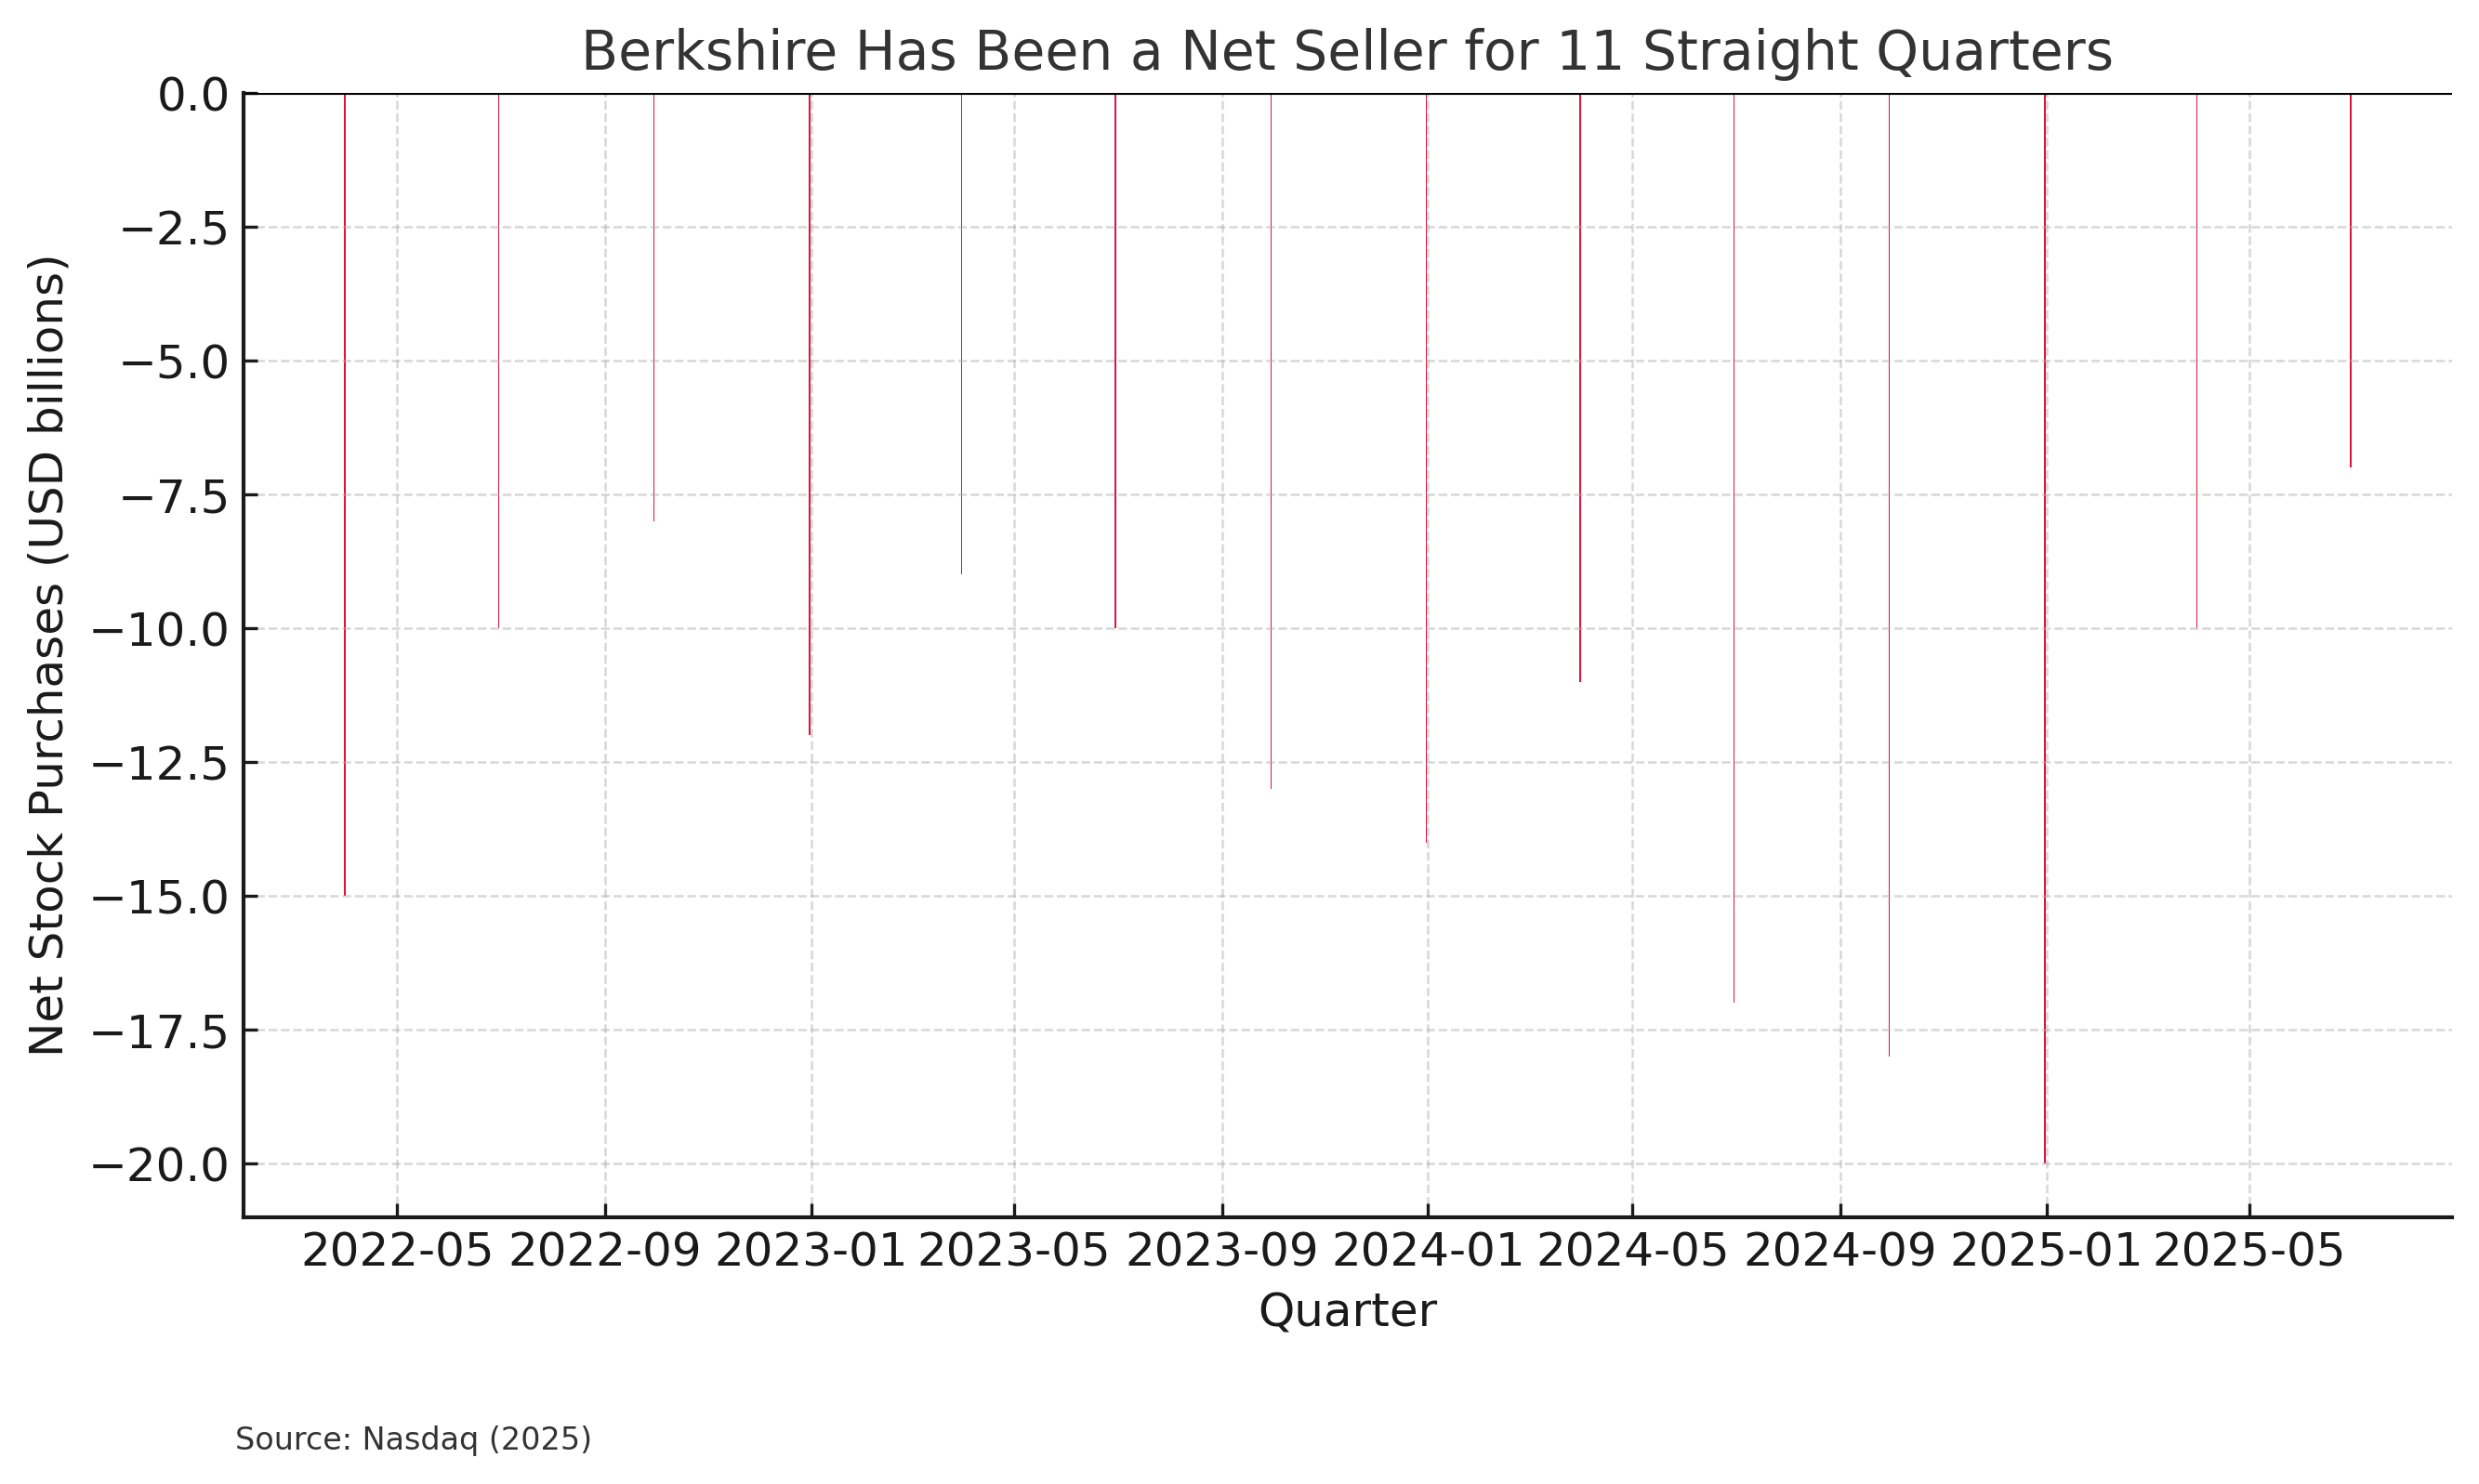
Berkshire’s cash position reflects Buffett’s caution amid few attractive opportunities. The firm has been a net seller for 11 consecutive quarters, unloading roughly $177 billion more in stocks than it purchased since 2022³. Even long-time favorites such as Apple and Bank of America were trimmed; Berkshire cut its Apple stake by roughly two-thirds⁴. Buffett has long preached: “Be fearful when others are greedy.” Today, he admits it is difficult to find value in a historically expensive market⁵.

<figure>
<source type="image/webp" />
<svg class="lucide lucide-refresh-cw" fill="none" height="20" stroke="currentColor" stroke-linecap="round" stroke-linejoin="round" stroke-width="2" viewBox="0 0 24 24" width="20" xmlns="http://www.w3.org/2000/svg"><path d="M3 12a9 9 0 0 1 9-9 9.75 9.75 0 0 1 6.74 2.74L21 8"></path><path d="M21 3v5h-5"></path><path d="M21 12a9 9 0 0 1-9 9 9.75 9.75 0 0 1-6.74-2.74L3 16"></path><path d="M8 16H3v5"></path></svg>
<svg class="lucide lucide-maximize2 lucide-maximize-2" fill="none" height="20" stroke="currentColor" stroke-linecap="round" stroke-linejoin="round" stroke-width="2" viewBox="0 0 24 24" width="20" xmlns="http://www.w3.org/2000/svg"><polyline points="15 3 21 3 21 9"></polyline><polyline points="9 21 3 21 3 15"></polyline><line x1="21" x2="14" y1="3" y2="10"></line><line x1="3" x2="10" y1="21" y2="14"></line></svg>
</figure>

Rather than chase momentum, Buffett is content to hold cash and earn billions in risk-free interest income while waiting for better entry points⁶. With policy rates at multi-decade highs, even idle cash now pays—a stark contrast to the zero-rate era when “cash was trash.” Size also limits his options: few acquisitions can “move the needle” for a $1 trillion conglomerate⁷. Berkshire’s recent $10 billion chemicals acquisition, its largest in years, barely dented reserves⁸.

This “rainy-day fund” gives Buffett flexibility to strike when prices fall. It also signals that, in his view, most assets are priced without a margin of safety. He would rather underperform in euphoric periods than overpay—a stance consistent with his mantra of “extreme fiscal conservatism.”⁹

Valuations Near Historical Extremes

To grasp Buffett’s restraint, consider market valuations. The S&P 500 trades near 23 times forward earnings, well above its 10-year average and approaching levels last seen in the late-1990s tech bubble¹⁰. On trailing earnings, the multiple exceeds 30—roughly 67 percent above the long-term norm¹¹.

<figure>
<source type="image/webp" />
<svg class="lucide lucide-refresh-cw" fill="none" height="20" stroke="currentColor" stroke-linecap="round" stroke-linejoin="round" stroke-width="2" viewBox="0 0 24 24" width="20" xmlns="http://www.w3.org/2000/svg"><path d="M3 12a9 9 0 0 1 9-9 9.75 9.75 0 0 1 6.74 2.74L21 8"></path><path d="M21 3v5h-5"></path><path d="M21 12a9 9 0 0 1-9 9 9.75 9.75 0 0 1-6.74-2.74L3 16"></path><path d="M8 16H3v5"></path></svg>
<svg class="lucide lucide-maximize2 lucide-maximize-2" fill="none" height="20" stroke="currentColor" stroke-linecap="round" stroke-linejoin="round" stroke-width="2" viewBox="0 0 24 24" width="20" xmlns="http://www.w3.org/2000/svg"><polyline points="15 3 21 3 21 9"></polyline><polyline points="9 21 3 21 3 15"></polyline><line x1="21" x2="14" y1="3" y2="10"></line><line x1="3" x2="10" y1="21" y2="14"></line></svg>
</figure>

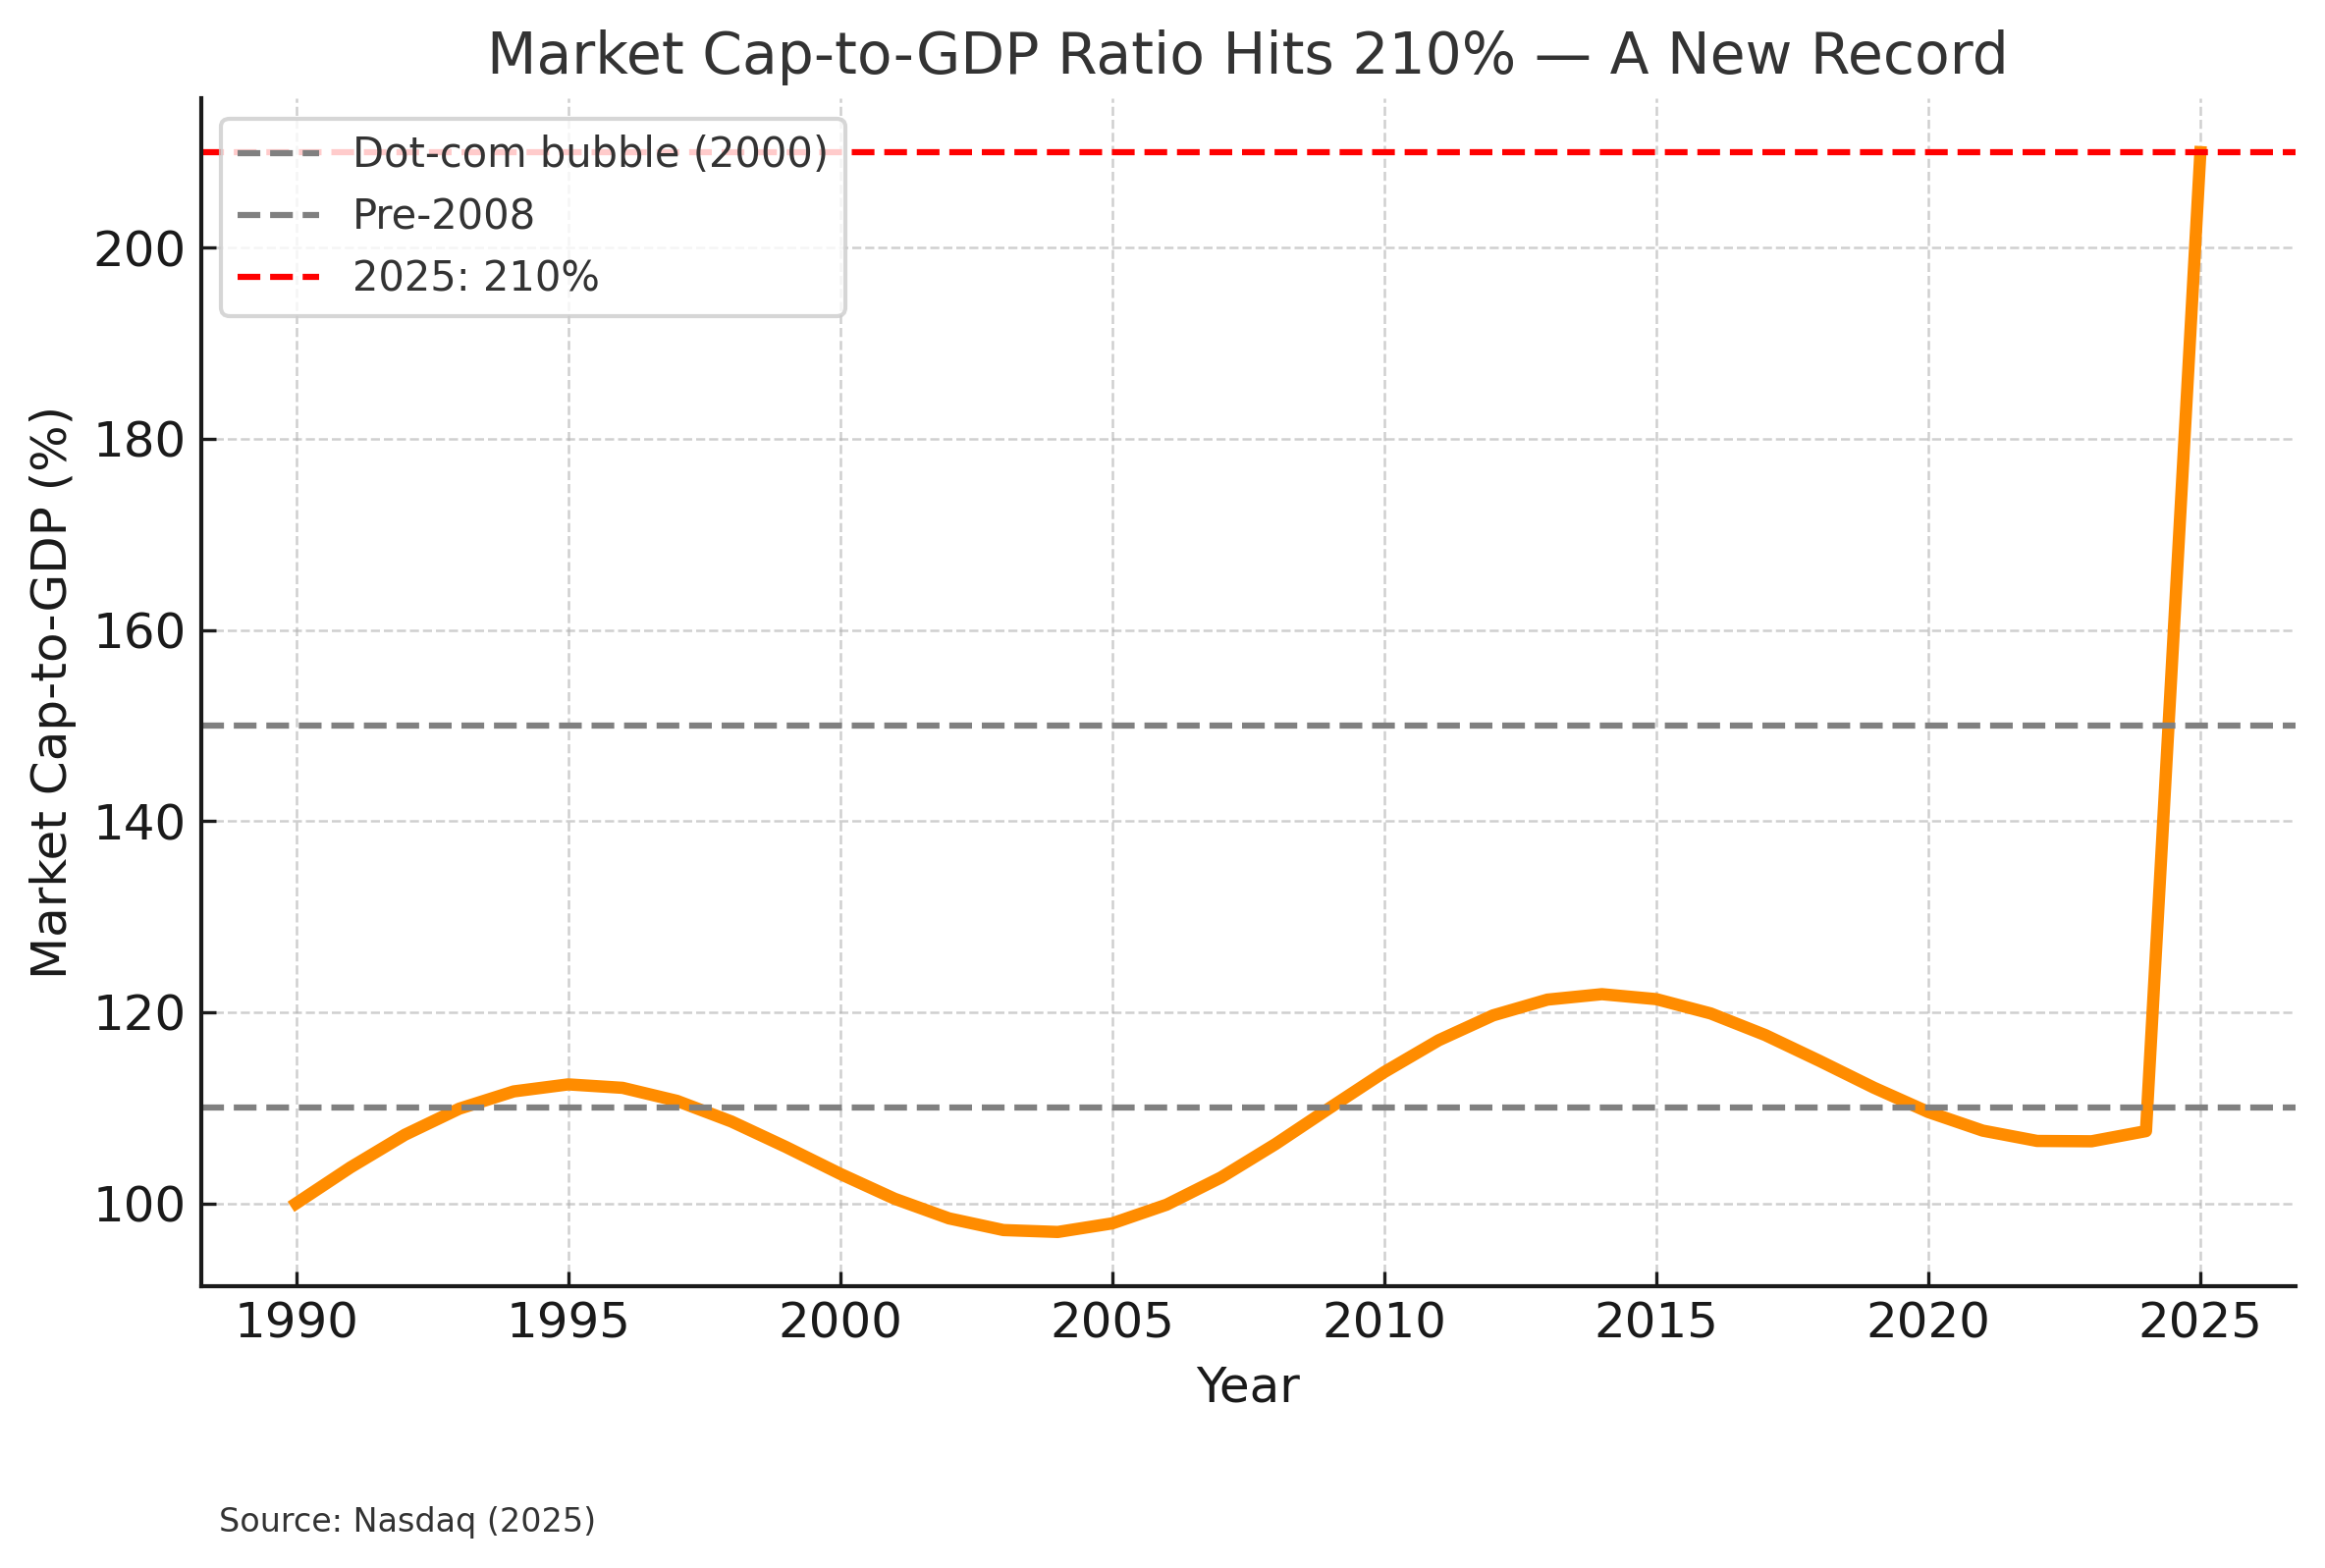
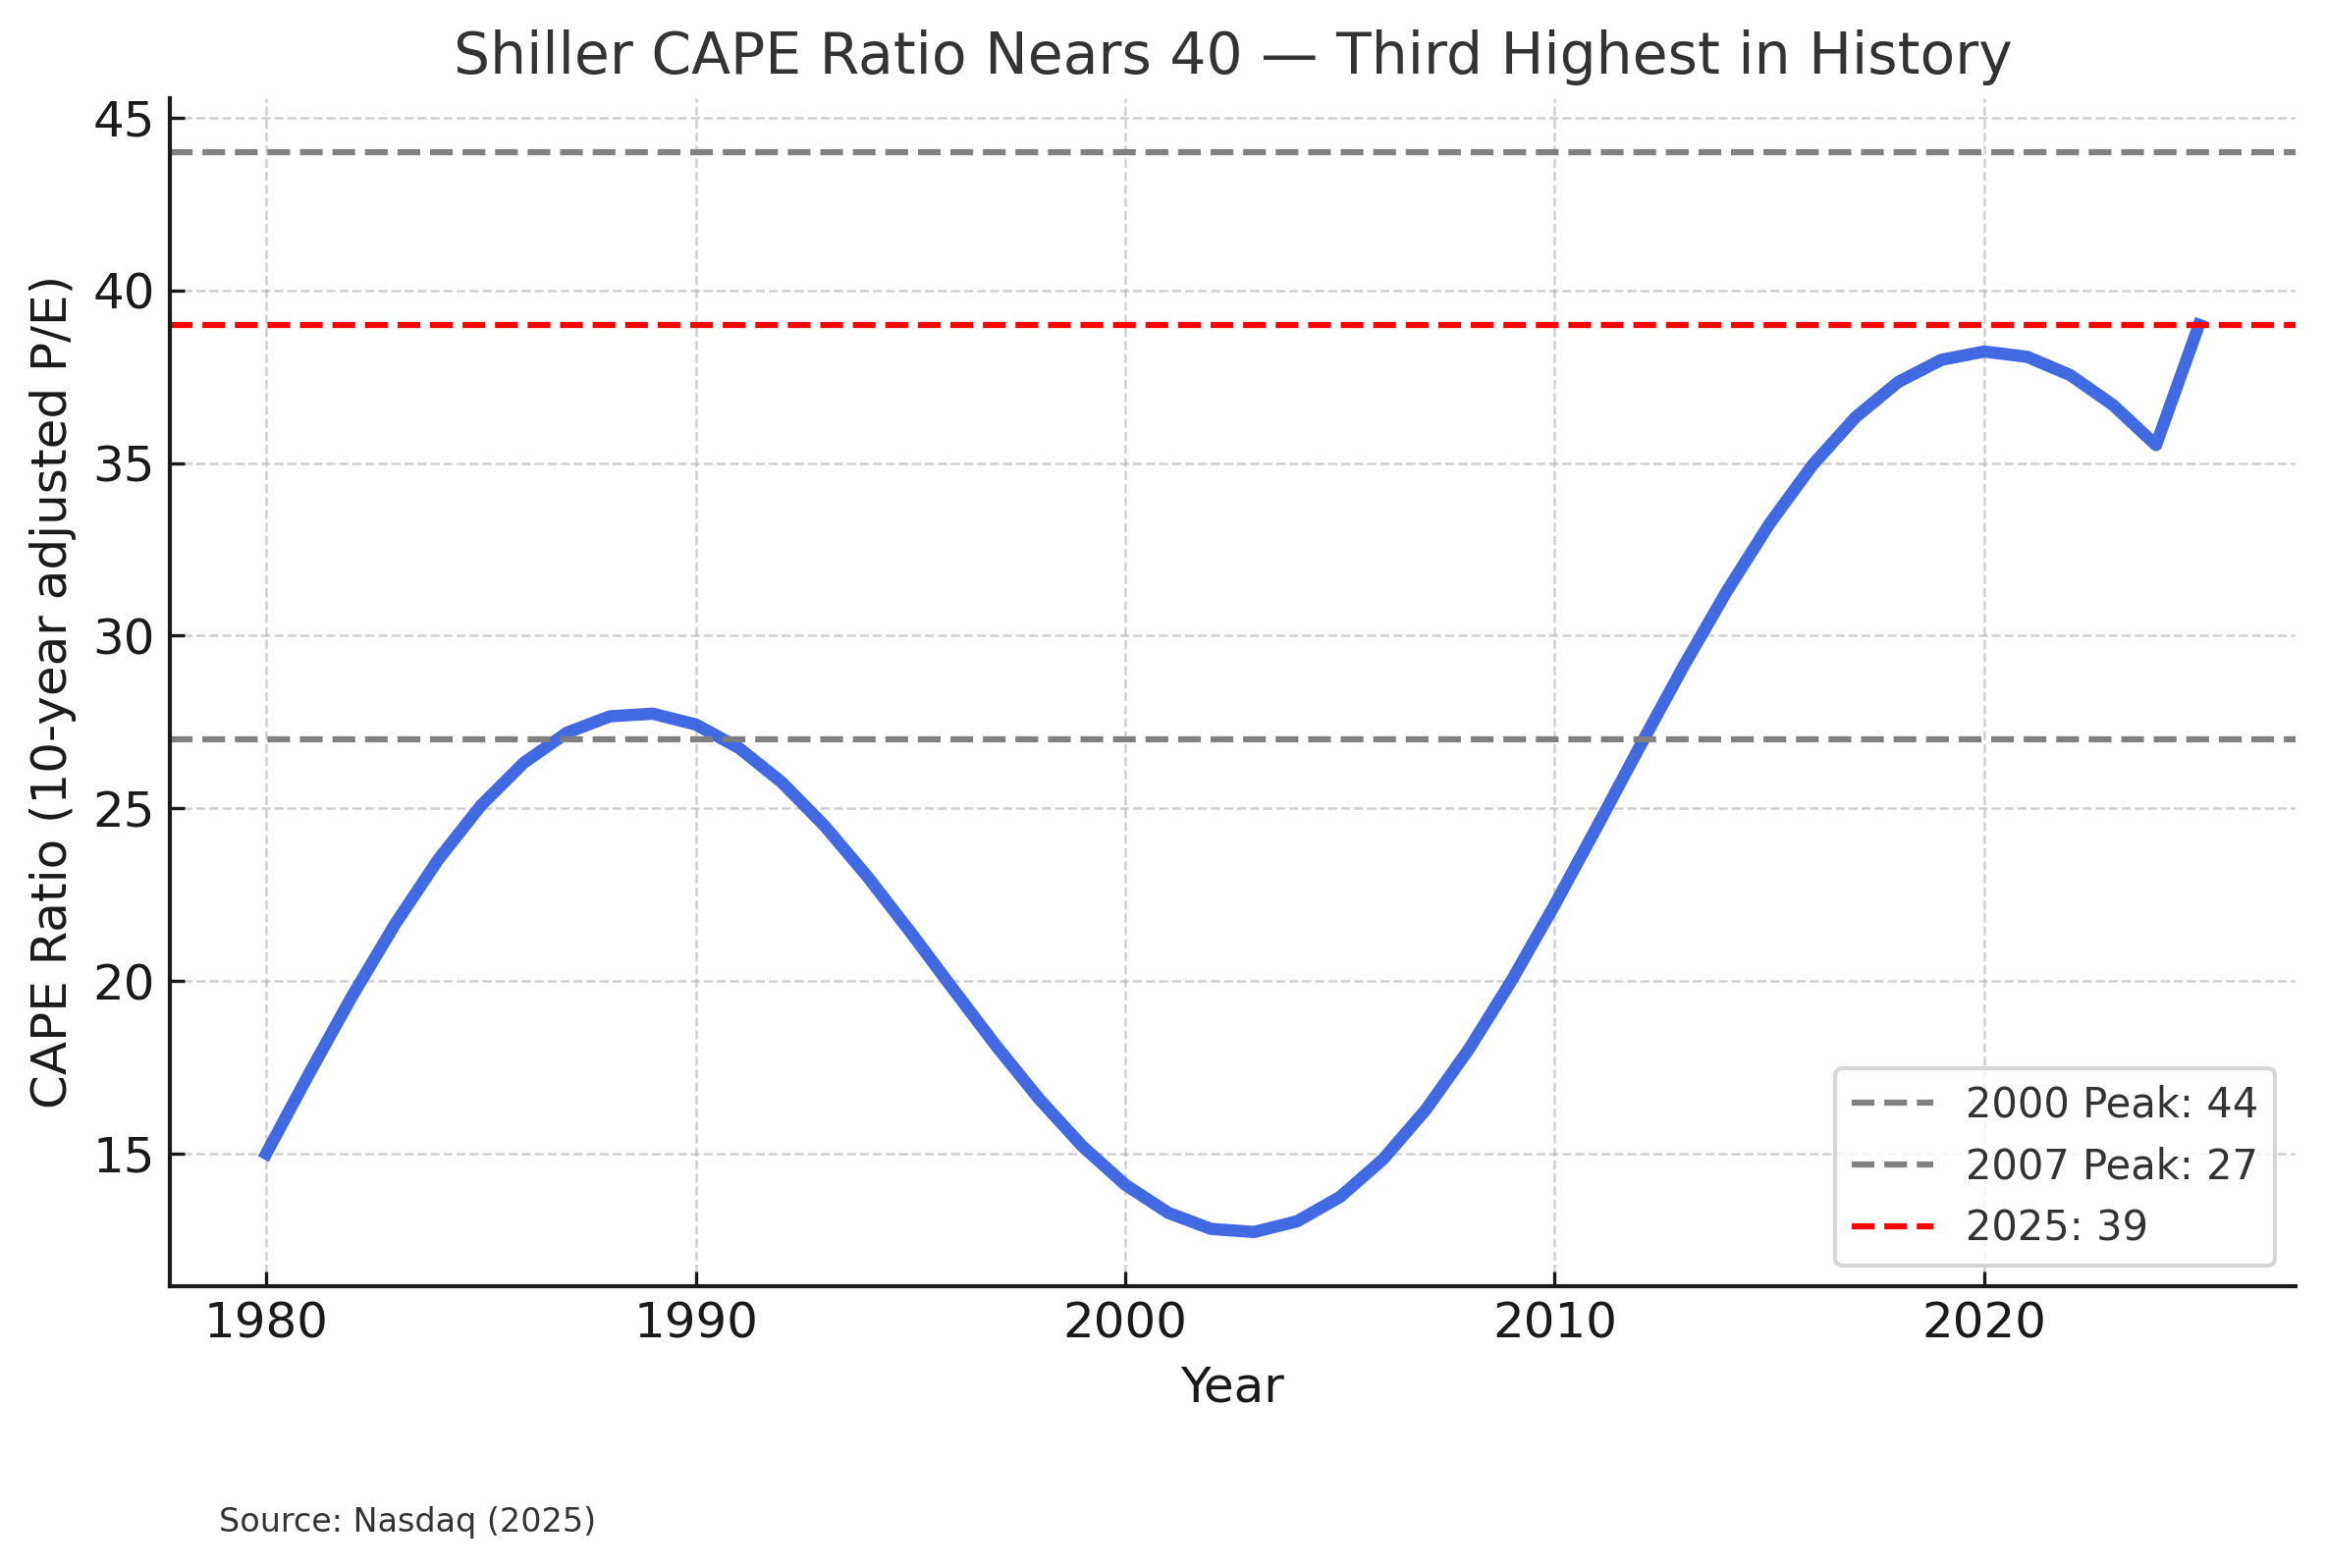
Buffett’s own yardstick, the “Buffett Indicator” (total U.S. market capitalization divided by GDP), recently topped 210 percent, an all-time high¹². That means the market’s value is more than double the size of the economy—a ratio surpassing even the dot-com mania. Another measure, the Shiller CAPE, hovers around 39, versus a 20th-century average near 17¹³. The only prior periods above 30—the late 1990s and mid-2000s—were followed by steep declines¹⁴.

<figure>
<source type="image/webp" />
<svg class="lucide lucide-refresh-cw" fill="none" height="20" stroke="currentColor" stroke-linecap="round" stroke-linejoin="round" stroke-width="2" viewBox="0 0 24 24" width="20" xmlns="http://www.w3.org/2000/svg"><path d="M3 12a9 9 0 0 1 9-9 9.75 9.75 0 0 1 6.74 2.74L21 8"></path><path d="M21 3v5h-5"></path><path d="M21 12a9 9 0 0 1-9 9 9.75 9.75 0 0 1-6.74-2.74L3 16"></path><path d="M8 16H3v5"></path></svg>
<svg class="lucide lucide-maximize2 lucide-maximize-2" fill="none" height="20" stroke="currentColor" stroke-linecap="round" stroke-linejoin="round" stroke-width="2" viewBox="0 0 24 24" width="20" xmlns="http://www.w3.org/2000/svg"><polyline points="15 3 21 3 21 9"></polyline><polyline points="9 21 3 21 3 15"></polyline><line x1="21" x2="14" y1="3" y2="10"></line><line x1="3" x2="10" y1="21" y2="14"></line></svg>
</figure>

No indicator can time a crash, but such extremes suggest future returns may be modest and risks elevated. Buffett’s discipline leads him to wait rather than chase. “De

Comments 
In Channel
loading
00:00
00:00
x

0.5x

0.8x

1.0x

1.25x

1.5x

2.0x

3.0x

Sleep Timer

Off

End of Episode

5 Minutes

10 Minutes

15 Minutes

30 Minutes

45 Minutes

60 Minutes

120 Minutes

Why Warren Buffett Is Sitting on Record Cash — and What That Says About the Market

Why Warren Buffett Is Sitting on Record Cash — and What That Says About the Market

Michael A. Gayed, CFA