DiscoverCapital Flows and Asset MarketsSOMETHING WICKED THIS WAY COMES - UPDATE 2
SOMETHING WICKED THIS WAY COMES - UPDATE 2

SOMETHING WICKED THIS WAY COMES - UPDATE 2

Update: 2025-09-04
Share

Description

Subscribe now

<figure>
<source type="image/webp" />
<svg class="lucide lucide-refresh-cw" fill="none" height="20" stroke="currentColor" stroke-linecap="round" stroke-linejoin="round" stroke-width="2" viewBox="0 0 24 24" width="20" xmlns="http://www.w3.org/2000/svg"><path d="M3 12a9 9 0 0 1 9-9 9.75 9.75 0 0 1 6.74 2.74L21 8"></path><path d="M21 3v5h-5"></path><path d="M21 12a9 9 0 0 1-9 9 9.75 9.75 0 0 1-6.74-2.74L3 16"></path><path d="M8 16H3v5"></path></svg>
<svg class="lucide lucide-maximize2 lucide-maximize-2" fill="none" height="20" stroke="currentColor" stroke-linecap="round" stroke-linejoin="round" stroke-width="2" viewBox="0 0 24 24" width="20" xmlns="http://www.w3.org/2000/svg"><polyline points="15 3 21 3 21 9"></polyline><polyline points="9 21 3 21 3 15"></polyline><line x1="21" x2="14" y1="3" y2="10"></line><line x1="3" x2="10" y1="21" y2="14"></line></svg>
</figure>

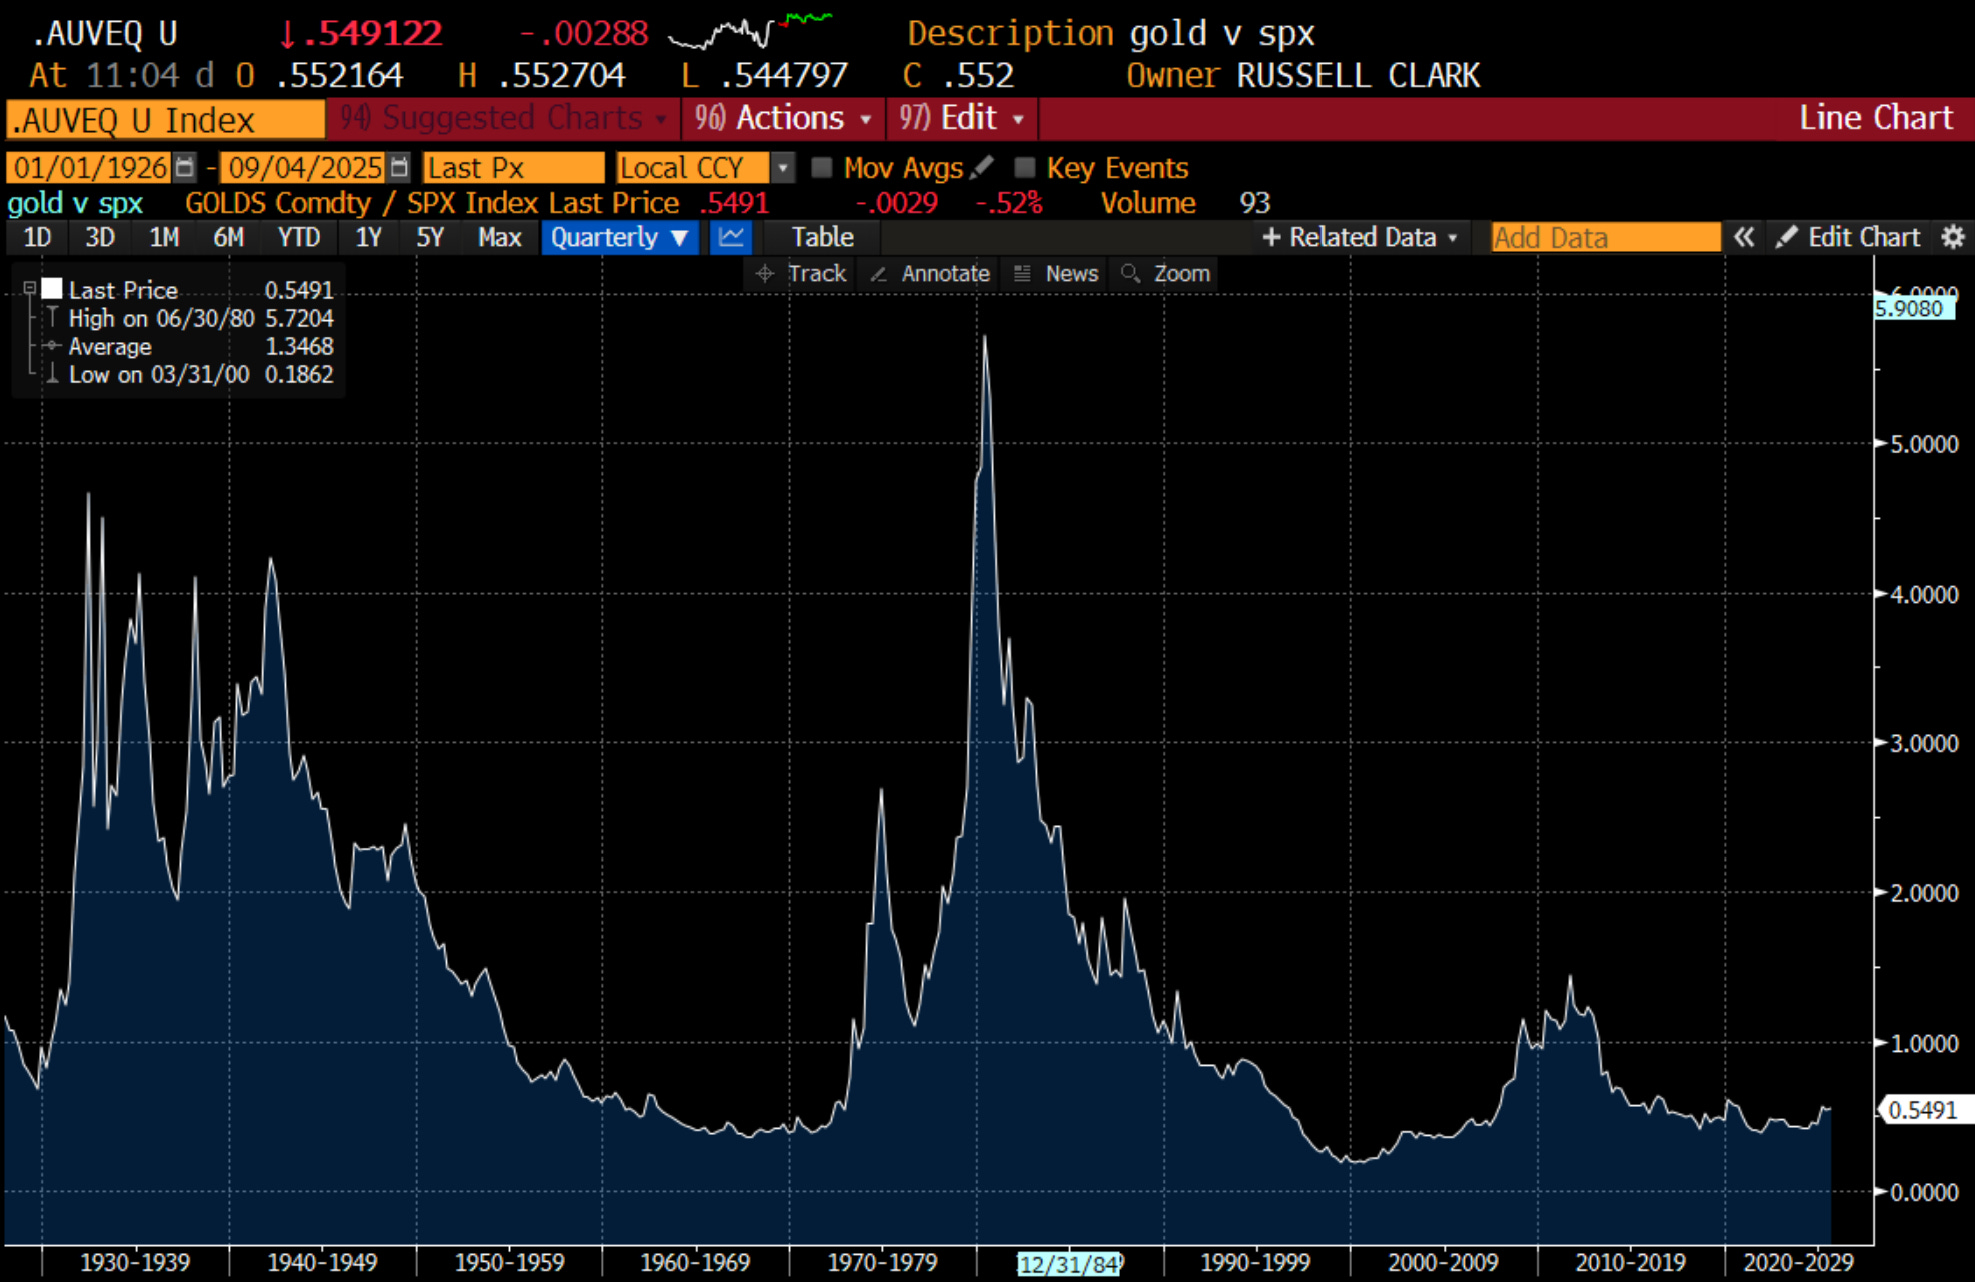
The Gold/S&P 500 ratio got back to the 200MDA, and then spiked again.

<figure>
<source type="image/webp" />
<svg class="lucide lucide-refresh-cw" fill="none" height="20" stroke="currentColor" stroke-linecap="round" stroke-linejoin="round" stroke-width="2" viewBox="0 0 24 24" width="20" xmlns="http://www.w3.org/2000/svg"><path d="M3 12a9 9 0 0 1 9-9 9.75 9.75 0 0 1 6.74 2.74L21 8"></path><path d="M21 3v5h-5"></path><path d="M21 12a9 9 0 0 1-9 9 9.75 9.75 0 0 1-6.74-2.74L3 16"></path><path d="M8 16H3v5"></path></svg>
<svg class="lucide lucide-maximize2 lucide-maximize-2" fill="none" height="20" stroke="currentColor" stroke-linecap="round" stroke-linejoin="round" stroke-width="2" viewBox="0 0 24 24" width="20" xmlns="http://www.w3.org/2000/svg"><polyline points="15 3 21 3 21 9"></polyline><polyline points="9 21 3 21 3 15"></polyline><line x1="21" x2="14" y1="3" y2="10"></line><line x1="3" x2="10" y1="21" y2="14"></line></svg>
</figure>

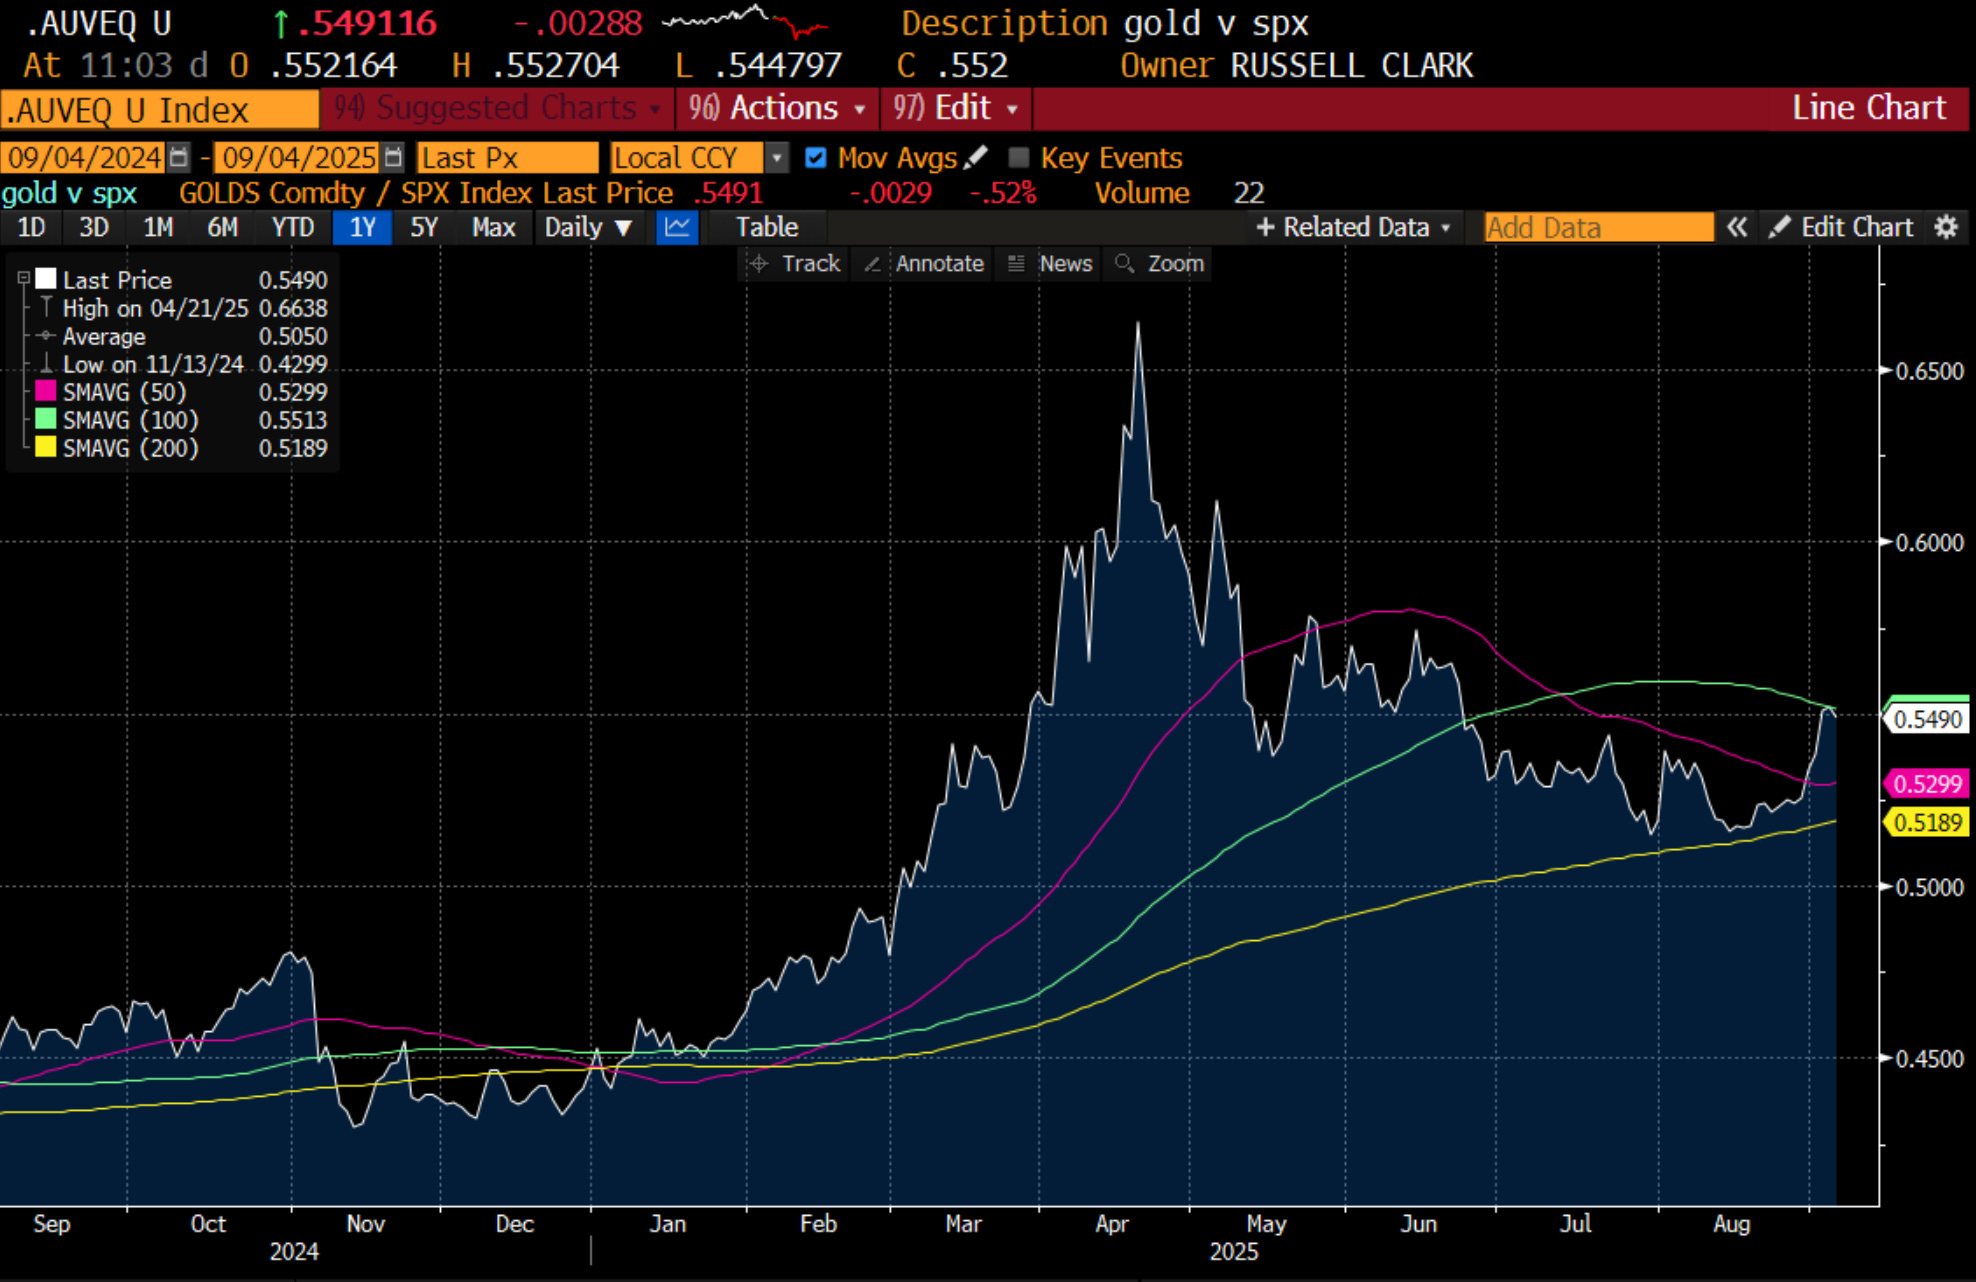
Which makes a larger turn in the market more likely, implying either a bigger fall in the S&P 500 or a larger spike in gold.

<figure>
<source type="image/webp" />
<svg class="lucide lucide-refresh-cw" fill="none" height="20" stroke="currentColor" stroke-linecap="round" stroke-linejoin="round" stroke-width="2" viewBox="0 0 24 24" width="20" xmlns="http://www.w3.org/2000/svg"><path d="M3 12a9 9 0 0 1 9-9 9.75 9.75 0 0 1 6.74 2.74L21 8"></path><path d="M21 3v5h-5"></path><path d="M21 12a9 9 0 0 1-9 9 9.75 9.75 0 0 1-6.74-2.74L3 16"></path><path d="M8 16H3v5"></path></svg>
<svg class="lucide lucide-maximize2 lucide-maximize-2" fill="none" height="20" stroke="currentColor" stroke-linecap="round" stroke-linejoin="round" stroke-width="2" viewBox="0 0 24 24" width="20" xmlns="http://www.w3.org/2000/svg"><polyline points="15 3 21 3 21 9"></polyline><polyline points="9 21 3 21 3 15"></polyline><line x1="21" x2="14" y1="3" y2="10"></line><line x1="3" x2="10" y1="21" y2="14"></line></svg>
</figure>

And GLD/TLT finally broke out of its range.

<figure>
<source type="image/webp" />
<svg class="lucide lucide-refresh-cw" fill="none" height="20" stroke="currentColor" stroke-linecap="round" stroke-linejoin="round" stroke-width="2" viewBox="0 0 24 24" width="20" xmlns="http://www.w3.org/2000/svg"><path d="M3 12a9 9 0 0 1 9-9 9.75 9.75 0 0 1 6.74 2.74L21 8"></path><path d="M21 3v5h-5"></path><path d="M21 12a9 9 0 0 1-9 9 9.75 9.75 0 0 1-6.74-2.74L3 16"></path><path d="M8 16H3v5"></path></svg>
<svg class="lucide lucide-maximize2 lucide-maximize-2" fill="none" height="20" stroke="currentColor" stroke-linecap="round" stroke-linejoin="round" stroke-width="2" viewBox="0 0 24 24" width="20" xmlns="http://www.w3.org/2000/svg"><polyline points="15 3 21 3 21 9"></polyline><polyline points="9 21 3 21 3 15"></polyline><line x1="21" x2="14" y1="3" y2="10"></line><line x1="3" x2="10" y1="21" y2="14"></line></svg>
</figure>

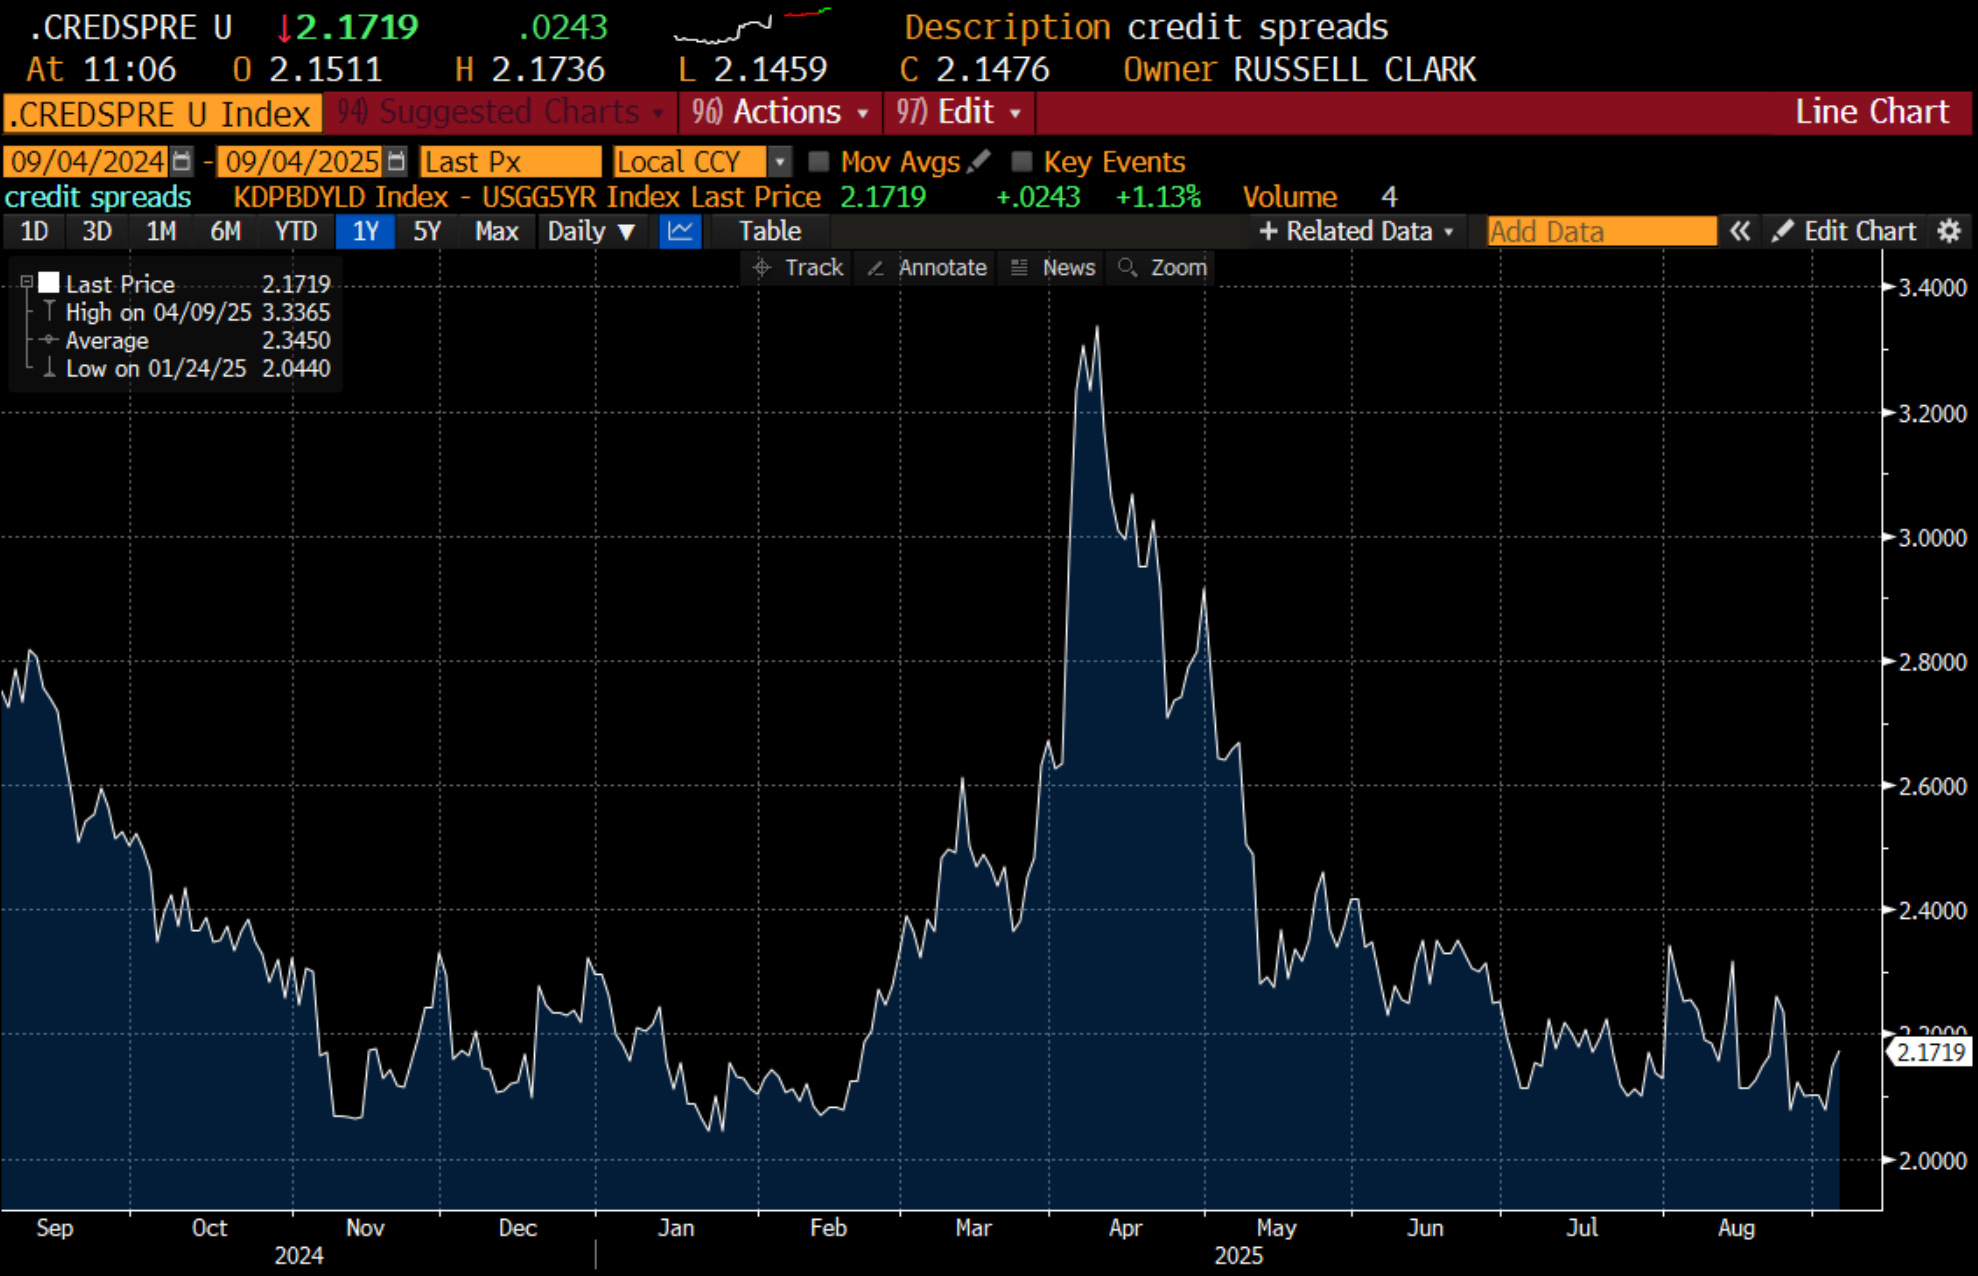
Credit spreads have widened a tad - from very low levels.

<figure>
<source type="image/webp" />
<svg class="lucide lucide-refresh-cw" fill="none" height="20" stroke="currentColor" stroke-linecap="round" stroke-linejoin="round" stroke-width="2" viewBox="0 0 24 24" width="20" xmlns="http://www.w3.org/2000/svg"><path d="M3 12a9 9 0 0 1 9-9 9.75 9.75 0 0 1 6.74 2.74L21 8"></path><path d="M21 3v5h-5"></path><path d="M21 12a9 9 0 0 1-9 9 9.75 9.75 0 0 1-6.74-2.74L3 16"></path><path d="M8 16H3v5"></path></svg>
<svg class="lucide lucide-maximize2 lucide-maximize-2" fill="none" height="20" stroke="currentColor" stroke-linecap="round" stroke-linejoin="round" stroke-width="2" viewBox="0 0 24 24" width="20" xmlns="http://www.w3.org/2000/svg"><polyline points="15 3 21 3 21 9"></polyline><polyline points="9 21 3 21 3 15"></polyline><line x1="21" x2="14" y1="3" y2="10"></line><line x1="3" x2="10" y1="21" y2="14"></line></svg>
</figure>

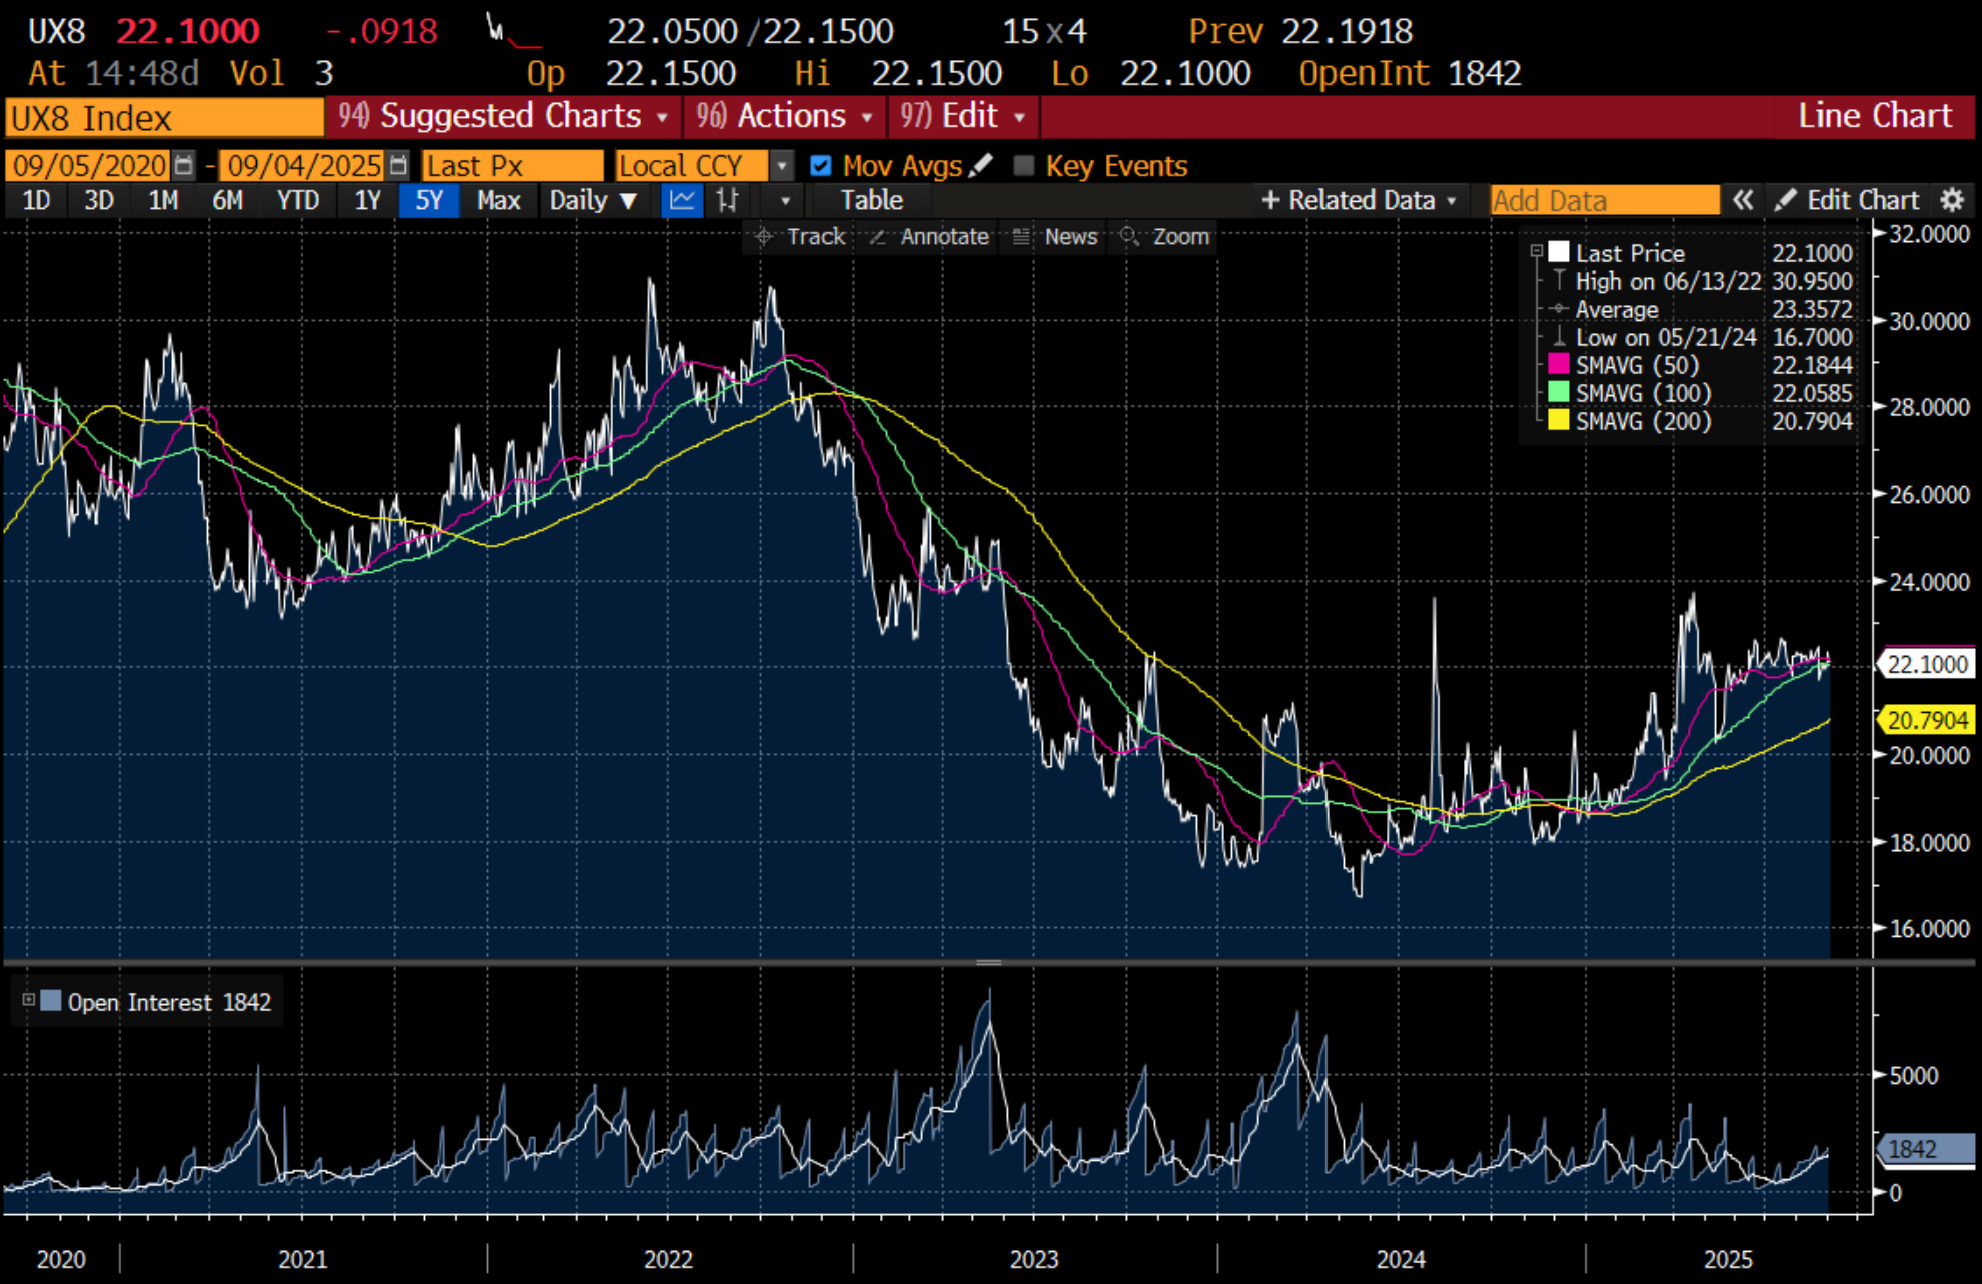
8 month VIX continues to trade richly - something I have taken to imply that investors are keen to hedge risk.

00:00
00:00
x

0.5x

0.8x

1.0x

1.25x

1.5x

2.0x

3.0x

Sleep Timer

Off

End of Episode

5 Minutes

10 Minutes

15 Minutes

30 Minutes

45 Minutes

60 Minutes

120 Minutes

SOMETHING WICKED THIS WAY COMES - UPDATE 2

SOMETHING WICKED THIS WAY COMES - UPDATE 2

Russell Clark