BRUMBY UPDATE

BRUMBY UPDATE

Update: 2025-08-03
Share

Description

Subscribe now

<figure>
<source type="image/webp" />
<svg class="lucide lucide-refresh-cw" fill="none" height="20" stroke="currentColor" stroke-linecap="round" stroke-linejoin="round" stroke-width="2" viewBox="0 0 24 24" width="20" xmlns="http://www.w3.org/2000/svg"><path d="M3 12a9 9 0 0 1 9-9 9.75 9.75 0 0 1 6.74 2.74L21 8"></path><path d="M21 3v5h-5"></path><path d="M21 12a9 9 0 0 1-9 9 9.75 9.75 0 0 1-6.74-2.74L3 16"></path><path d="M8 16H3v5"></path></svg>
<svg class="lucide lucide-maximize2 lucide-maximize-2" fill="none" height="20" stroke="currentColor" stroke-linecap="round" stroke-linejoin="round" stroke-width="2" viewBox="0 0 24 24" width="20" xmlns="http://www.w3.org/2000/svg"><polyline points="15 3 21 3 21 9"></polyline><polyline points="9 21 3 21 3 15"></polyline><line x1="21" x2="14" y1="3" y2="10"></line><line x1="3" x2="10" y1="21" y2="14"></line></svg>
</figure>

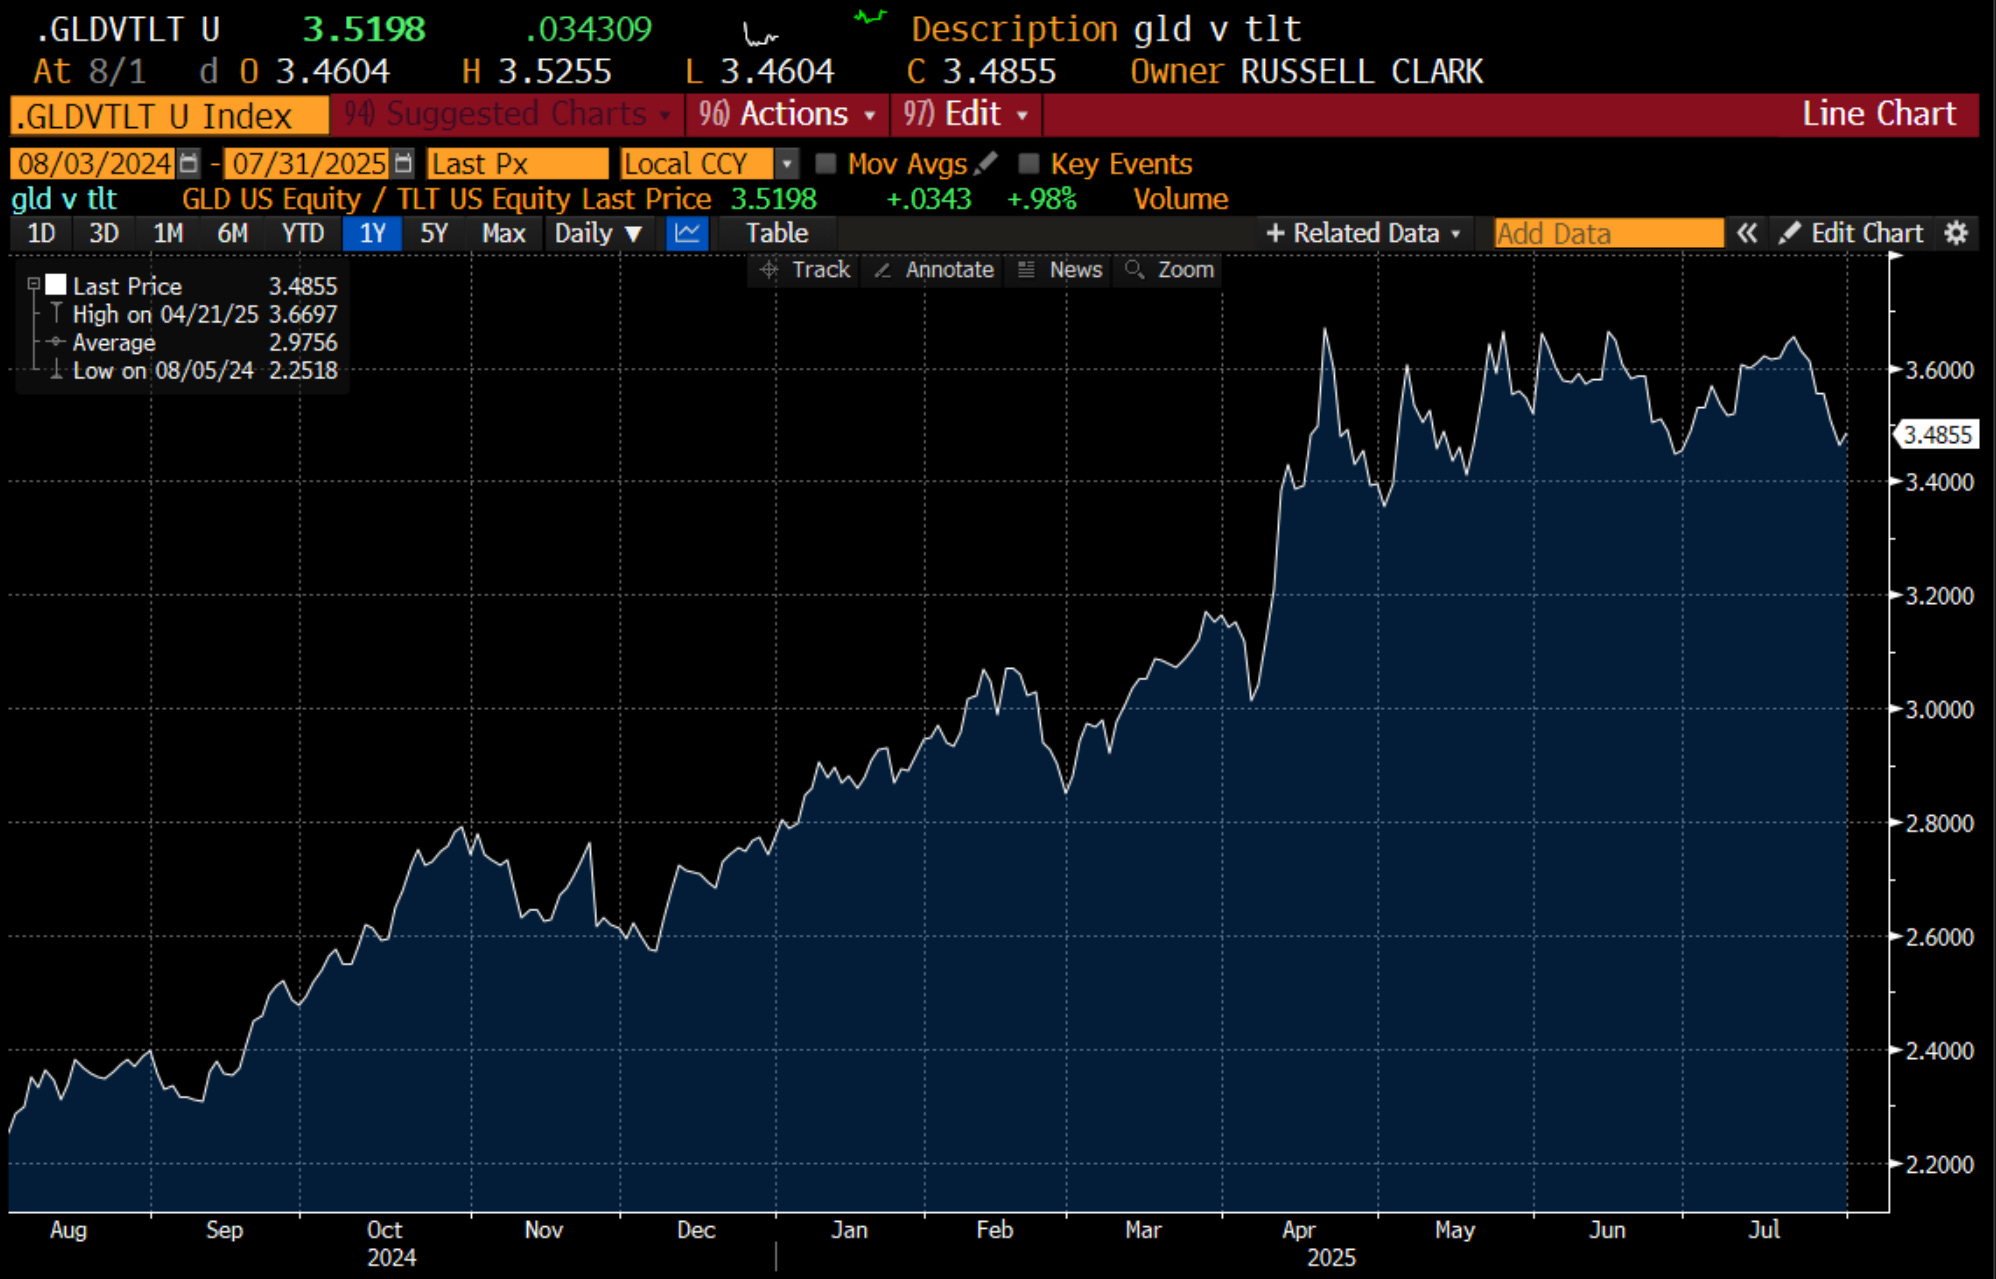
July was a volatile month. The core trade of GLD/TLT broke higher during July, to then pull back in the last week to finish near lows.

<figure>
<source type="image/webp" />
<svg class="lucide lucide-refresh-cw" fill="none" height="20" stroke="currentColor" stroke-linecap="round" stroke-linejoin="round" stroke-width="2" viewBox="0 0 24 24" width="20" xmlns="http://www.w3.org/2000/svg"><path d="M3 12a9 9 0 0 1 9-9 9.75 9.75 0 0 1 6.74 2.74L21 8"></path><path d="M21 3v5h-5"></path><path d="M21 12a9 9 0 0 1-9 9 9.75 9.75 0 0 1-6.74-2.74L3 16"></path><path d="M8 16H3v5"></path></svg>
<svg class="lucide lucide-maximize2 lucide-maximize-2" fill="none" height="20" stroke="currentColor" stroke-linecap="round" stroke-linejoin="round" stroke-width="2" viewBox="0 0 24 24" width="20" xmlns="http://www.w3.org/2000/svg"><polyline points="15 3 21 3 21 9"></polyline><polyline points="9 21 3 21 3 15"></polyline><line x1="21" x2="14" y1="3" y2="10"></line><line x1="3" x2="10" y1="21" y2="14"></line></svg>
</figure>

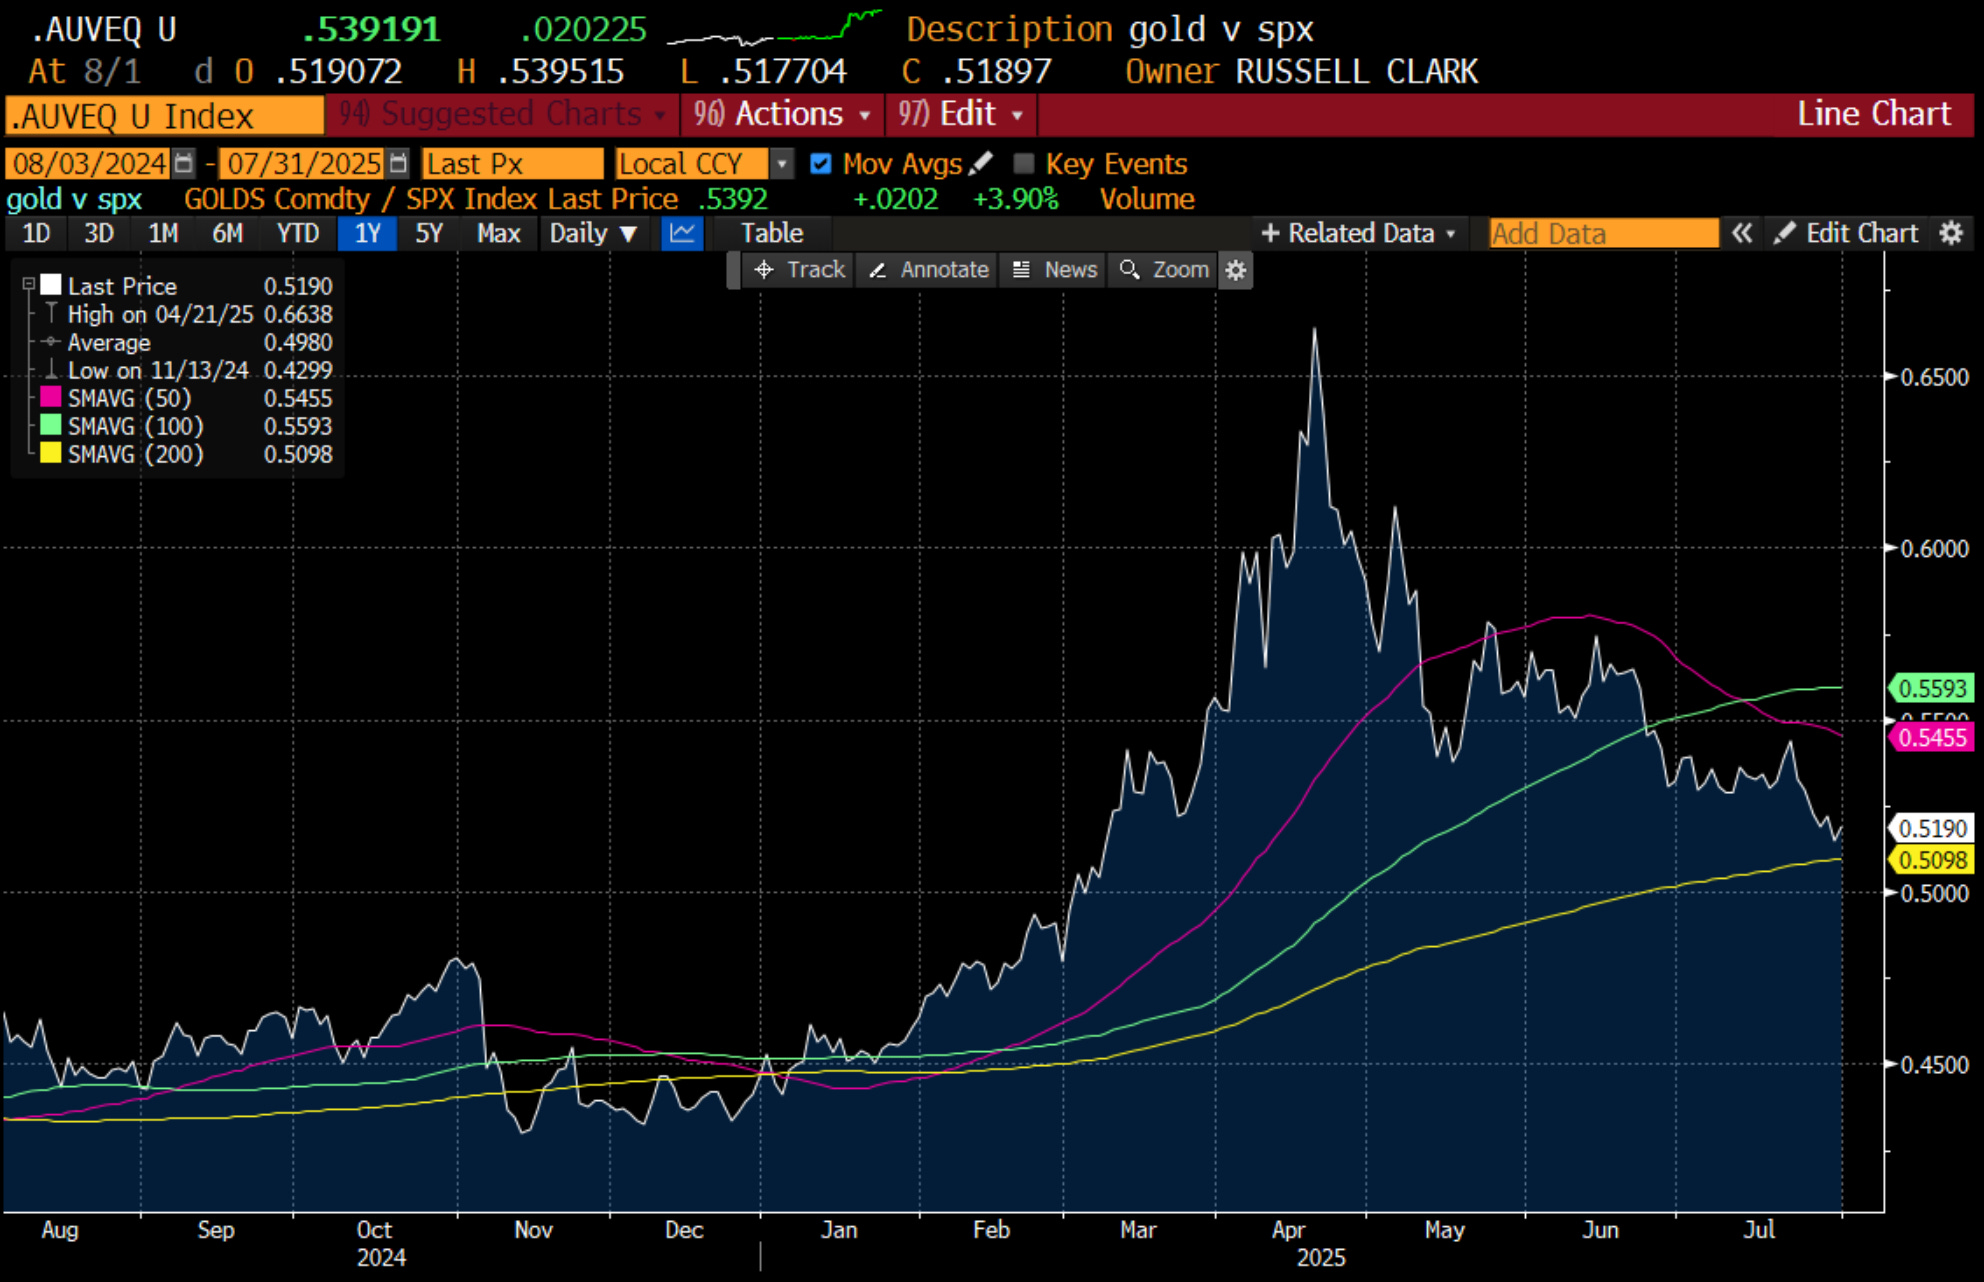
The other core trade of gold versus S&P 500 had a late month breakdown to approach the 200MDA.

<figure>
<source type="image/webp" />
<svg class="lucide lucide-refresh-cw" fill="none" height="20" stroke="currentColor" stroke-linecap="round" stroke-linejoin="round" stroke-width="2" viewBox="0 0 24 24" width="20" xmlns="http://www.w3.org/2000/svg"><path d="M3 12a9 9 0 0 1 9-9 9.75 9.75 0 0 1 6.74 2.74L21 8"></path><path d="M21 3v5h-5"></path><path d="M21 12a9 9 0 0 1-9 9 9.75 9.75 0 0 1-6.74-2.74L3 16"></path><path d="M8 16H3v5"></path></svg>
<svg class="lucide lucide-maximize2 lucide-maximize-2" fill="none" height="20" stroke="currentColor" stroke-linecap="round" stroke-linejoin="round" stroke-width="2" viewBox="0 0 24 24" width="20" xmlns="http://www.w3.org/2000/svg"><polyline points="15 3 21 3 21 9"></polyline><polyline points="9 21 3 21 3 15"></polyline><line x1="21" x2="14" y1="3" y2="10"></line><line x1="3" x2="10" y1="21" y2="14"></line></svg>
</figure>

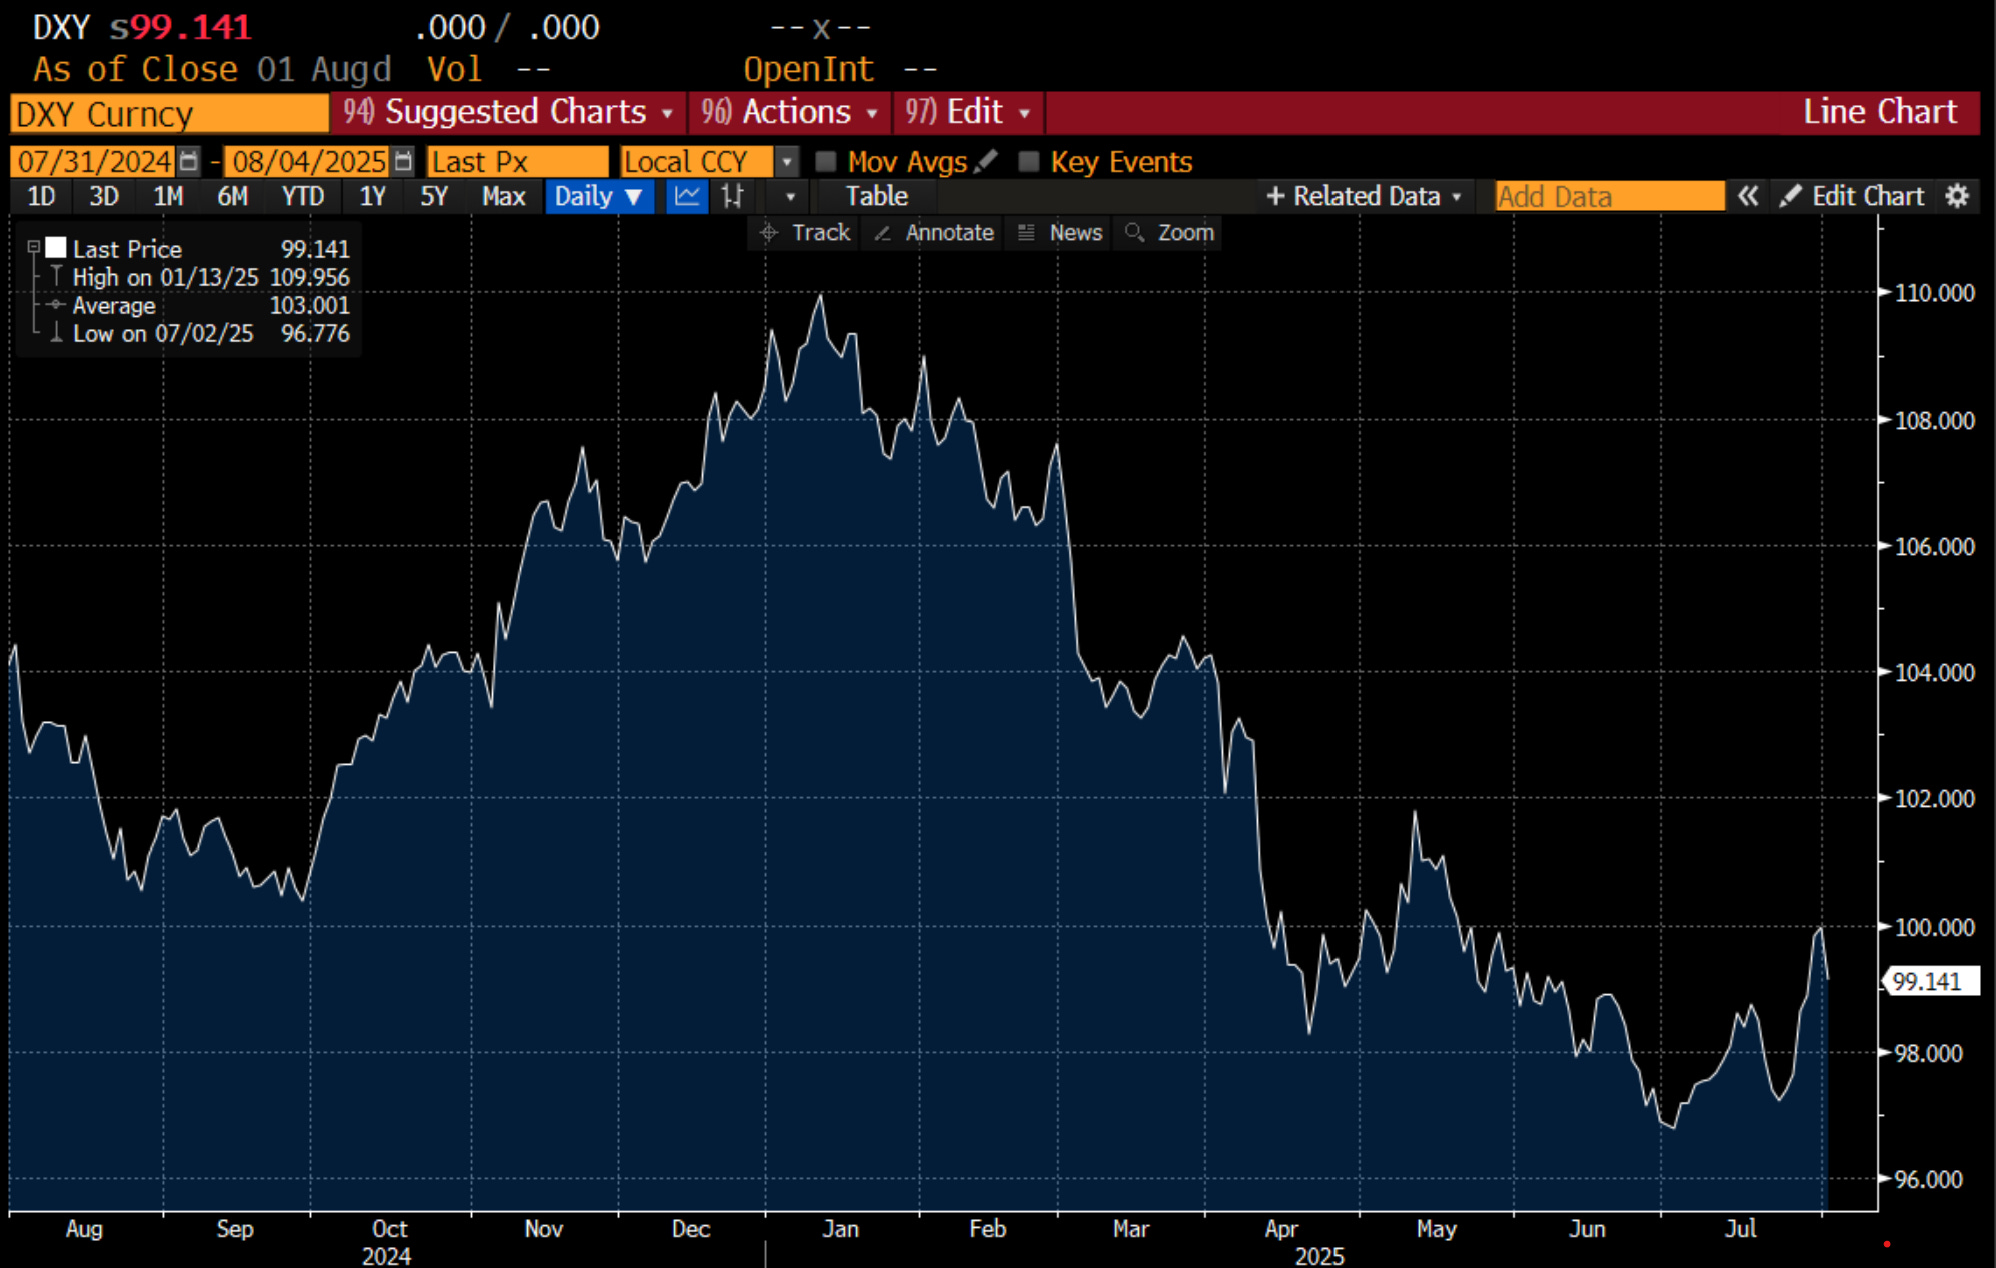
The Dollar Index also saw a late month rally.

<figure>
<source type="image/webp" />
<svg class="lucide lucide-refresh-cw" fill="none" height="20" stroke="currentColor" stroke-linecap="round" stroke-linejoin="round" stroke-width="2" viewBox="0 0 24 24" width="20" xmlns="http://www.w3.org/2000/svg"><path d="M3 12a9 9 0 0 1 9-9 9.75 9.75 0 0 1 6.74 2.74L21 8"></path><path d="M21 3v5h-5"></path><path d="M21 12a9 9 0 0 1-9 9 9.75 9.75 0 0 1-6.74-2.74L3 16"></path><path d="M8 16H3v5"></path></svg>
<svg class="lucide lucide-maximize2 lucide-maximize-2" fill="none" height="20" stroke="currentColor" stroke-linecap="round" stroke-linejoin="round" stroke-width="2" viewBox="0 0 24 24" width="20" xmlns="http://www.w3.org/2000/svg"><polyline points="15 3 21 3 21 9"></polyline><polyline points="9 21 3 21 3 15"></polyline><line x1="21" x2="14" y1="3" y2="10"></line><line x1="3" x2="10" y1="21" y2="14"></line></svg>
</figure>

With so many core themes reversing in the final week of July, we ended up having a down month. However I did take of the advantage of the strength of the dollar to add to dollar weakness trades. As much as the late month trend reversals disturb me, I can not forget the “correlation break” we saw earlier this year, when treasuries and dollar sold off as equities weakened. The Economist provides a useful graph.

<figure>
<source type="image/webp" />Image preview
<svg class="lucide lucide-refresh-cw" fill="none" height="20" stroke="currentColor" stroke-linecap="round" stroke-linejoin="round" stroke-width="2" viewBox="0 0 24 24" width="20" xmlns="http://www.w3.org/2000/svg"><path d="M3 12a9 9 0 0 1 9-9 9.75 9.75 0 0 1 6.74 2.74L21 8"></path><path d="M21 3v5h-5"></path><path d="M21 12a9 9 0 0 1-9 9 9.75 9.75 0 0 1-6.74-2.74L3 16"></path><path d="M8 16H3v5"></path></svg>
<svg class="lucide lucide-maximize2 lucide-maximize-2" fill="none" height="20" stroke="currentColor" stroke-linecap="round" stroke-linejoin="round" stroke-width="2" viewBox="0 0 24 24" width="20" xmlns="http://www.w3.org/2000/svg"><polyline points="15 3 21 3 21 9"></polyline><polyline points="9 21 3 21 3 15"></polyline><line x1="21" x2="14" y1="3" y2="10"></line><line x1="3" x2="10" y1="21" y2="14"></line></svg>
</figure>


Read more

Comments 
00:00
00:00
x

0.5x

0.8x

1.0x

1.25x

1.5x

2.0x

3.0x

Sleep Timer

Off

End of Episode

5 Minutes

10 Minutes

15 Minutes

30 Minutes

45 Minutes

60 Minutes

120 Minutes

BRUMBY UPDATE

BRUMBY UPDATE

Russell Clark